PROTECTED SOURCE SCRIPT
已更新 RSI MTF HW
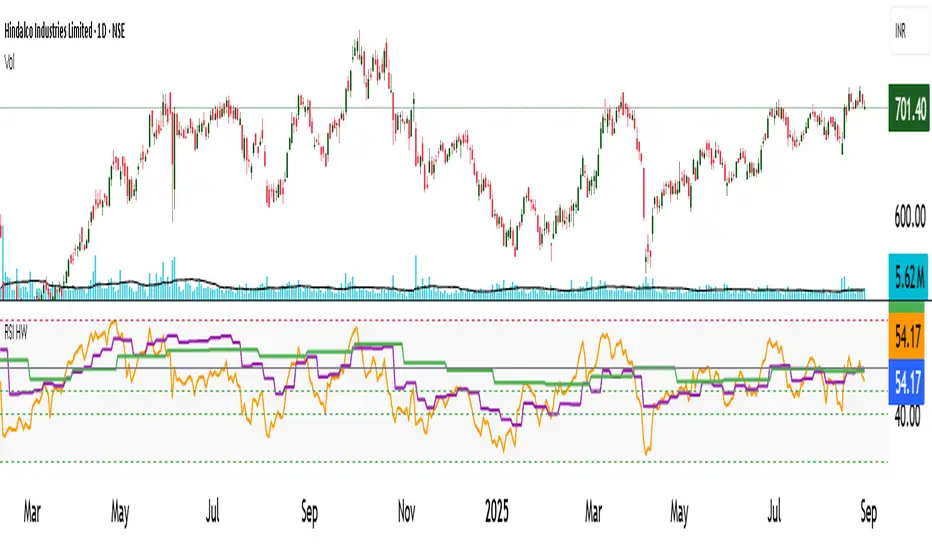
This Pine Script indicator is designed to provide a comprehensive view of market momentum by plotting the Relative Strength Index (RSI) from four different time frames simultaneously on a single chart. This allows traders to quickly identify alignment or divergence in momentum across various time horizons, which can be a powerful tool for confirming trade setups or spotting potential trend reversals.
Key Features:
Customizable Inputs: The indicator provides a flexible set of user inputs, including a dropdown menu to select the data source for the RSI calculation (e.g., close, open, high, low). You can also define four separate RSI lengths to analyze different periods.
Multi-Time Frame Analysis: A key feature is the ability to choose a time frame for each of the four RSI lines from a predefined list (Chart, 1 day, 1 week, 1 month). The script uses the request.security() function with lookahead enabled to ensure the most accurate, real-time data is used for each calculation, eliminating look-ahead bias and calculation errors.
Visual Levels: The indicator plots standard RSI levels at 30, 50, and 70, with a shaded background between the oversold (30) and overbought (70) zones to provide a clear visual reference.
Momentum Alignment Signals: The script includes an optional feature that highlights the chart's background with a red or green color when all four RSIs simultaneously enter an overbought or oversold state. This serves as an immediate visual alert for a strong, multi-time frame momentum condition.
This indicator is a robust tool for technical analysis, suitable for traders who use a top-down approach to their market analysis.
發行說明
This Pine Script indicator is designed to provide a comprehensive view of market momentum by plotting the Relative Strength Index (RSI) from four different time frames simultaneously on a single chart. This allows traders to quickly identify alignment or divergence in momentum across various time horizons, which can be a powerful tool for confirming trade setups or spotting potential trend reversals.Key Features:
Customizable Inputs: The indicator provides a flexible set of user inputs, including a dropdown menu to select the data source for the RSI calculation (e.g., close, open, high, low). You can also define four separate RSI lengths to analyze different periods.
Multi-Time Frame Analysis: A key feature is the ability to choose a time frame for each of the four RSI lines from a predefined list (Chart, 1 day, 1 week, 1 month). The script uses the request.security() function with lookahead enabled to ensure the most accurate, real-time data is used for each calculation, eliminating look-ahead bias and calculation errors.
Visual Levels: The indicator plots standard RSI levels at 30, 50, and 70, with a shaded background between the oversold (30) and overbought (70) zones to provide a clear visual reference.
Momentum Alignment Signals: The script includes an optional feature that highlights the chart's background with a red or green color when all four RSIs simultaneously enter an overbought or oversold state. This serves as an immediate visual alert for a strong, multi-time frame momentum condition.
This indicator is a robust tool for technical analysis, suitable for traders who use a top-down approach to their market analysis.
受保護腳本
此腳本以閉源形式發佈。 不過,您可以自由使用,沒有任何限制 — 點擊此處了解更多。
免責聲明
這些資訊和出版物並非旨在提供,也不構成TradingView提供或認可的任何形式的財務、投資、交易或其他類型的建議或推薦。請閱讀使用條款以了解更多資訊。
受保護腳本
此腳本以閉源形式發佈。 不過,您可以自由使用,沒有任何限制 — 點擊此處了解更多。
免責聲明
這些資訊和出版物並非旨在提供,也不構成TradingView提供或認可的任何形式的財務、投資、交易或其他類型的建議或推薦。請閱讀使用條款以了解更多資訊。