PROTECTED SOURCE SCRIPT
Low Liquidity Marker
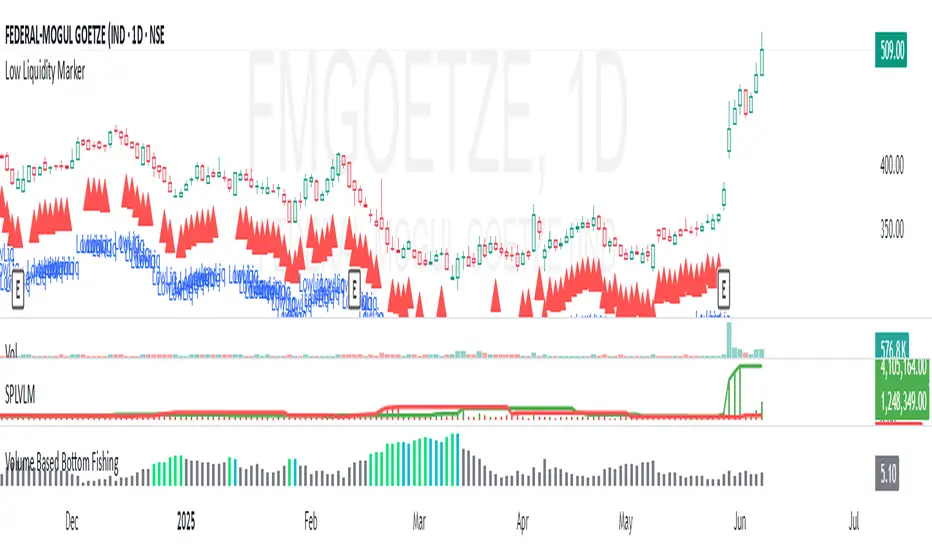
📘 Indicator Description – Low Liquidity Marker
The Low Liquidity Marker is a simple yet powerful tool designed to highlight candles where Volume × Low Price falls below a customizable threshold — signaling potential low liquidity zones on the chart.
🔍 How it works:
It calculates volume × low for each candle.
When this value drops below your defined threshold, a red triangle is plotted below that bar.
These bars may indicate poor institutional participation or market inefficiency.
⚠️ Why it matters:
Low liquidity makes it difficult to build or exit large positions efficiently.
Stocks or instruments flagged by this tool may be suitable for small capital investments but are generally unsuitable for high-volume or institutional-grade trading.
Use this indicator to filter out illiquid setups when screening for quality trades.
🛠 Customizable Input:
Volume × Low Threshold: Tune this parameter based on your instrument or trading timeframe.
💡 Ideal For:
Retail traders avoiding illiquid zones.
Investors wanting to identify where the market lacks sufficient depth.
Enhancing trade filters in systematic or discretionary setups.
受保護腳本
此腳本以閉源形式發佈。 不過,您可以自由使用,沒有任何限制 — 點擊此處了解更多。
免責聲明
這些資訊和出版物並非旨在提供,也不構成TradingView提供或認可的任何形式的財務、投資、交易或其他類型的建議或推薦。請閱讀使用條款以了解更多資訊。
受保護腳本
此腳本以閉源形式發佈。 不過,您可以自由使用,沒有任何限制 — 點擊此處了解更多。
免責聲明
這些資訊和出版物並非旨在提供,也不構成TradingView提供或認可的任何形式的財務、投資、交易或其他類型的建議或推薦。請閱讀使用條款以了解更多資訊。