INVITE-ONLY SCRIPT
已更新 RP trend reader
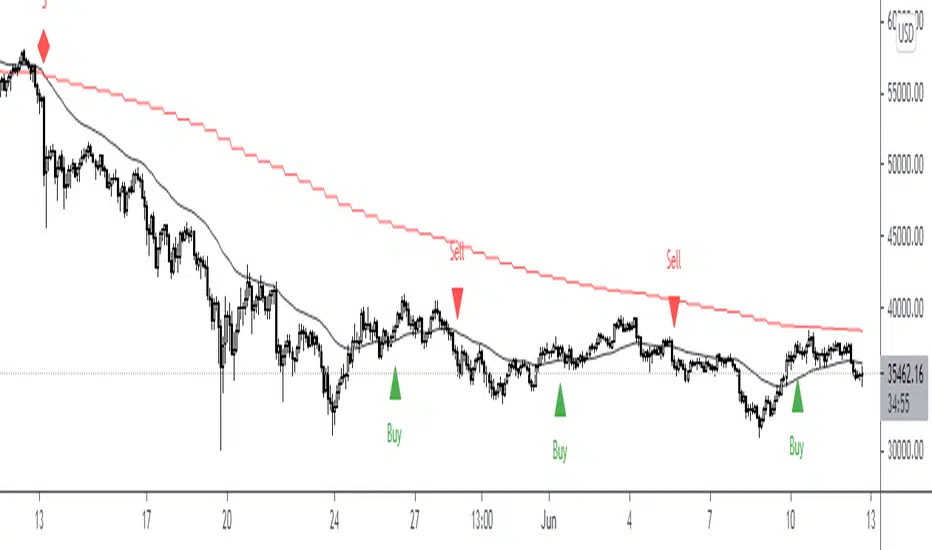
This tool is a momentum reader
You can use this tools at any timeframe
When the momentum is meet the condition then it will show the signal
The signal are "Buy" and "Sell"
Buy means that you Long or exit your Short at the price
Sell means that you Short or exit your Long at the price
There's pivot line at there
Pivot line is showing how strong the momentum right now
If the price above or way above the pivot line then the uptrend is strong (very bullish)
If the price below or way below the pivot line then the downtrend is strong (very bearish)
Don't blindly Buy or Sell just because the signal is coming out
Combine it with the market structure, look at the big picture instead lower TF and the edge is yours
The best entry is when the price bounce close to the pivot point
Be carefull with the sideway or choppy market. You can see that the price is going up and down at the pivot line and the signals come out quite often
Follow your trading plan, be patience (don't FOMO) and be discipline with your plan... Cheers...
發行說明
We put a new signal to help you spot the major directionit's called "Anchor Timeframe". We use 2H as the main timeframe and 12H as our "Anchor Timeframe"
We suggest that you use it as your anchor from your main timeframe
If you're a daytrader with Hourly TF, we suggest you put daily or higher TF at "Anchor Timeframe"
of if you use it at scalping with Minute TF, you can put the "Anchor Timeframe" at Hourly
There's a Pivot Anchor line too
It will help you to find out higher TF pivot line movement
Follow your trading plan, be patience (don't FOMO) and be discipline with your plan... Cheers...
僅限邀請腳本
只有經作者授權的使用者才能訪問此腳本,且通常需付費。您可以將此腳本加入收藏,但需先向作者申請並獲得許可後才能使用 — 點擊此處了解更多。如需更多詳情,請依照作者說明或直接聯繫rendypan030。
除非您完全信任其作者並了解腳本的工作原理,否則TradingView不建議您付費或使用腳本。您也可以在我們的社群腳本中找到免費的開源替代方案。
作者的說明
If you want the access you can send me DM or email me at rendypan030@gmail.com
提醒:在請求訪問權限之前,請閱讀僅限邀請腳本指南。
免責聲明
這些資訊和出版物並不意味著也不構成TradingView提供或認可的金融、投資、交易或其他類型的意見或建議。請在使用條款閱讀更多資訊。