OPEN-SOURCE SCRIPT
Buffett Indicator (Wilshire 5000 / GDP)
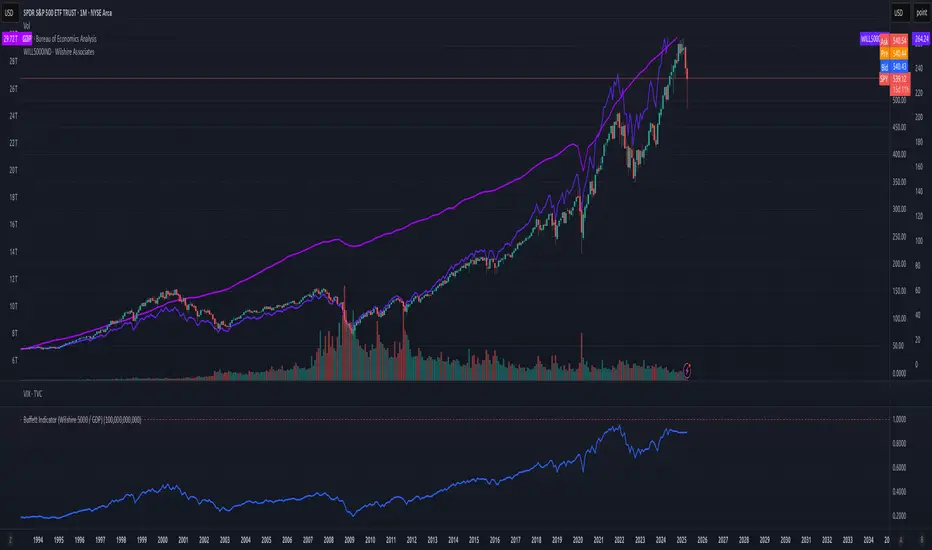
The Buffett Indicator (Wilshire 5000 / GDP) is a macroeconomic metric used to assess whether the U.S. stock market is overvalued or undervalued. It is calculated by dividing the total market capitalization (represented by the Wilshire 5000 Index) by the U.S. Gross Domestic Product (GDP). A value above 1 (or 100%) may indicate an overvalued market, while a value below 1 suggests potential undervaluation. This indicator is best suited for long-term investment analysis.
開源腳本
本著TradingView的真正精神,此腳本的創建者將其開源,以便交易者可以查看和驗證其功能。向作者致敬!雖然您可以免費使用它,但請記住,重新發佈程式碼必須遵守我們的網站規則。
免責聲明
這些資訊和出版物並不意味著也不構成TradingView提供或認可的金融、投資、交易或其他類型的意見或建議。請在使用條款閱讀更多資訊。
免責聲明
這些資訊和出版物並不意味著也不構成TradingView提供或認可的金融、投資、交易或其他類型的意見或建議。請在使用條款閱讀更多資訊。