PROTECTED SOURCE SCRIPT
已更新 SHA Session Killzones-[1.0.0]
🔰 SHA Session Killzones
Created by: [sha_fibo]
Version: 1.0.0
Timeframes: Optimized for 5m,10m, 15m, 30m, and 1h
✨ Description:
The SHA Session Killzones indicator automatically highlights the most volatile market hours — the Asian, London, and New York sessions — directly on your chart. Each killzone is color-coded and visually boxed to help you identify:
- 🟧 Asian Killzone (07:00–09:00)
- 🟦 London Killzone (13:00–15:00)
- 🟪 New York Killzone (19:00–21:00)
This indicator helps you:
- 🔍 Focus only on high-probability trading windows
- 🚫 Avoid low-liquidity traps
- 🔄 Plan breakout/reversal strategies during peak hours
- 📊 Use session highs/lows as key intraday S/R levels
⚙️ Features:
- Adjustable time zones (default: UTC+7)
- Automatic session labeling
- Clean and minimal visuals for optimal chart clarity
- Compatible with all instruments, especially Gold (XAUUSD)
🧠 How to Use:
- Use with your trading strategy to filter out noise
- Apply on 10m–30m timeframes for maximum precision
📌 Tip:
Use in confluence with market structure, volume spikes, or news catalysts for more effective entries.
發行說明
🔰 SHA Session KillzonesCreated by: [sha_fibo]
Version: 1.0.1
Timeframes: Optimized for 5m,10m, 15m, 30m, and 1h
✨ Description:
The SHA Session Killzones indicator automatically highlights the most volatile market hours — the Asian, London, and New York sessions — directly on your chart. Each killzone is color-coded and visually boxed to help you identify:
- 🟧 Asian Killzone (07:00–09:00)
- 🟦 London Killzone (13:00–15:00)
- 🟪 New York Killzone (19:00–21:00)
This indicator helps you:
- 🔍 Focus only on high-probability trading windows
- 🚫 Avoid low-liquidity traps
- 🔄 Plan breakout/reversal strategies during peak hours
- 📊 Use session highs/lows as key intraday S/R levels
⚙️ Features:
- Adjustable time zones (default: UTC+7)
- Automatic session labeling
- Clean and minimal visuals for optimal chart clarity
- Compatible with all instruments, especially Gold (XAUUSD)
🧠 How to Use:
- Use with your trading strategy to filter out noise
- Apply on 10m–30m timeframes for maximum precision
📌 Tip:
Use in confluence with market structure, volume spikes, or news catalysts for more effective entries.
發行說明
🔰 SHA Session KillzonesCreated by: [sha_fibo]
Version: 1.0.2
Timeframes: Optimized for 5m,10m, 15m, 30m, and 1h
⚙️ Update: v1.0.2
- Fix Price Range
✨ Description:
The SHA Session Killzones indicator automatically highlights the most volatile market hours — the Asian, London, and New York sessions — directly on your chart. Each killzone is color-coded and visually boxed to help you identify:
- 🟧 Asian Killzone (07:00–09:00)
- 🟦 London Killzone (13:00–15:00)
- 🟪 New York Killzone (19:00–21:00)
This indicator helps you:
- 🔍 Focus only on high-probability trading windows
- 🚫 Avoid low-liquidity traps
- 🔄 Plan breakout/reversal strategies during peak hours
- 📊 Use session highs/lows as key intraday S/R levels
⚙️ Features:
- Adjustable time zones (default: UTC+7)
- Automatic session labeling
- Clean and minimal visuals for optimal chart clarity
- Compatible with all instruments, especially Gold (XAUUSD)
🧠 How to Use:
- Use with your trading strategy to filter out noise
- Apply on 10m–30m timeframes for maximum precision
📌 Tip:
Use in confluence with market structure, volume spikes, or news catalysts for more effective entries.
發行說明
🔰 SHA Session Killzones
Created by: [sha_fibo]
Version: 1.0.3
Timeframes: Optimized for 5m,10m, 15m, 30m, and 1h
✨ Description:
The SHA Session Killzones indicator automatically highlights the most volatile market hours — the Asian, London, and New York sessions — directly on your chart. Each killzone is color-coded and visually boxed to help you identify:
- 🟧 Asian Killzone (07:00–09:00)
- 🟦 London Killzone (13:00–15:00)
- 🟪 New York Killzone (19:00–21:00)
This indicator helps you:
- 🔍 Focus only on high-probability trading windows
- 🚫 Avoid low-liquidity traps
- 🔄 Plan breakout/reversal strategies during peak hours
- 📊 Use session highs/lows as key intraday S/R levels
⚙️ Features:
- Adjustable time zones (default: UTC+7)
- Automatic session labeling
- Clean and minimal visuals for optimal chart clarity
- Compatible with all instruments, especially Gold (XAUUSD)
🧠 How to Use:
- Use with your trading strategy to filter out noise
- Apply on 10m–30m timeframes for maximum precision
🔄 Update v1.0.3
- Fix text session
📌 Tip:
Use in confluence with market structure, volume spikes, or news catalysts for more effective entries.
3 hours ago
Release Notes
🔰 SHA Session Killzones
Created by: [sha_fibo]
Version: 1.0.1
Timeframes: Optimized for 5m,10m, 15m, 30m, and 1h
✨ Description:
The SHA Session Killzones indicator automatically highlights the most volatile market hours — the Asian, London, and New York sessions — directly on your chart. Each killzone is color-coded and visually boxed to help you identify:
- 🟧 Asian Killzone (07:00–09:00)
- 🟦 London Killzone (13:00–15:00)
- 🟪 New York Killzone (19:00–21:00)
This indicator helps you:
- 🔍 Focus only on high-probability trading windows
- 🚫 Avoid low-liquidity traps
- 🔄 Plan breakout/reversal strategies during peak hours
- 📊 Use session highs/lows as key intraday S/R levels
⚙️ Features:
- Adjustable time zones (default: UTC+7)
- Automatic session labeling
- Clean and minimal visuals for optimal chart clarity
- Compatible with all instruments, especially Gold (XAUUSD)
🧠 How to Use:
- Use with your trading strategy to filter out noise
- Apply on 10m–30m timeframes for maximum precision
🔄 Update v1.0.3
- Fix text sesstion
📌 Tip:
Use in confluence with market structure, volume spikes, or news catalysts for more effective entries.
發行說明
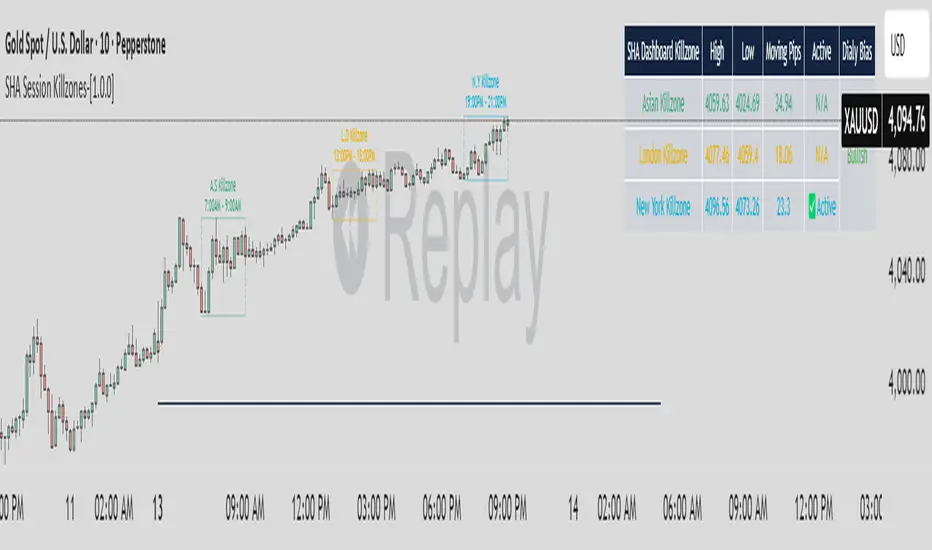
New Update : SHA Session Killzones [1.0.0] ✨🚀
The SHA Session Killzones indicator is a precision tool built to help traders identify and analyze market activity within the three major trading sessions — Asian, London, and New York.
By visually marking these killzones and calculating their respective price ranges.
🔍 Core Features
1. Dynamic Killzone Visualization
- Automatically plots session boxes for Asian, London, and New York killzones directly on your chart.
- Each session is color-coded for easy distinction and clarity.
- Perfect for identifying session overlaps (e.g., London–New York) where volume and volatility typically spike.
2. Session Range Analysis
- Calculates the High and Low for each session
- Displays total pip range in real time.
3. Bias Detection
- The dashboard displays Active Daily Bias (Bullish or Bearish) based on current price movement relative to Fibonacci's formulation.
- Every line of Daily Bias will draw once a day.
- This helps traders align their directional bias with the dominant market phase.
⚠️ Disclaimer
The information and tools provided in this script are for educational and informational purposes only.
Trading in the financial markets involves risk of loss and is not suitable for every investor. You are solely responsible for your trading decisions. Always do your own research, use proper risk management, and consult a licensed financial advisor before making any financial decisions.
受保護腳本
此腳本以閉源形式發佈。 不過,您可以自由使用,沒有任何限制 — 點擊此處了解更多。
免責聲明
這些資訊和出版物並非旨在提供,也不構成TradingView提供或認可的任何形式的財務、投資、交易或其他類型的建議或推薦。請閱讀使用條款以了解更多資訊。
免責聲明
這些資訊和出版物並非旨在提供,也不構成TradingView提供或認可的任何形式的財務、投資、交易或其他類型的建議或推薦。請閱讀使用條款以了解更多資訊。