INVITE-ONLY SCRIPT
已更新 Premium Dashboard [TFO]
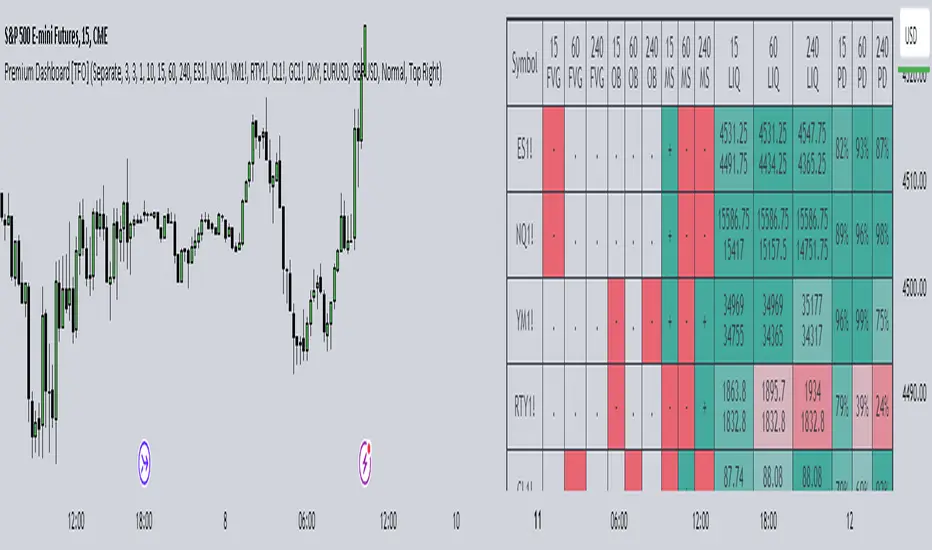
The purpose of this indicator is to serve as a scanner/dashboard for several symbols across multiple timeframes. At the time of release, the scanner looks for the following criteria on all selected timeframes:
- Whether price is in a Fair Value Gap (FVG)
- Whether price is in an Order Block (OB)
- Current Market Structure
- Nearest Liquidity Pivots
- Proximity to said Liquidity Pivots
For FVGs, the user selects a Displacement Strength to validate FVGs from the selected timeframes; larger values require greater displacement. The table will indicate whether price is presently trading in a valid bullish FVG, bearish FVG, or none.

With OBs, the user selects a similar Displacement Strength to validate OBs from the selected timeframes. Again, larger values require greater displacement to validate an OB. The table will indicate whether price is presently trading in a bullish OB, bearish OB, or none.

For Market Structure, the table will indicate whether the current structure is bullish or bearish on each respective timeframe. A pivot strength parameter is used to determine which swing highs and swing lows warrant valid Market Structure Shifts (reversals) or Breaks of Structure (continuations).

The Liquidity section of the dashboard displays the nearest Buyside and Sellside Liquidity (major highs and lows) from each respective timeframe. A similar pivot strength parameter is used to determine how "strong" the highs and lows must be in order to be considered valid.

The Premium / Discount section offers an alternative view of the nearest Liquidity Pivots, where it will instead display a percent value to describe how close price is to Buyside or Sellside Liquidity. Values approaching 100% imply price is trading close to the nearest Buyside Liquidity, while values approaching 0% imply price is trading close to Sellside Liquidity.

Users can also choose to show any of the above features on their current chart: FVGs, OBs, cumulative Market Structure, and Liquidity, all from the various selected timeframes.

- Whether price is in a Fair Value Gap (FVG)
- Whether price is in an Order Block (OB)
- Current Market Structure
- Nearest Liquidity Pivots
- Proximity to said Liquidity Pivots
For FVGs, the user selects a Displacement Strength to validate FVGs from the selected timeframes; larger values require greater displacement. The table will indicate whether price is presently trading in a valid bullish FVG, bearish FVG, or none.
With OBs, the user selects a similar Displacement Strength to validate OBs from the selected timeframes. Again, larger values require greater displacement to validate an OB. The table will indicate whether price is presently trading in a bullish OB, bearish OB, or none.
For Market Structure, the table will indicate whether the current structure is bullish or bearish on each respective timeframe. A pivot strength parameter is used to determine which swing highs and swing lows warrant valid Market Structure Shifts (reversals) or Breaks of Structure (continuations).
The Liquidity section of the dashboard displays the nearest Buyside and Sellside Liquidity (major highs and lows) from each respective timeframe. A similar pivot strength parameter is used to determine how "strong" the highs and lows must be in order to be considered valid.
The Premium / Discount section offers an alternative view of the nearest Liquidity Pivots, where it will instead display a percent value to describe how close price is to Buyside or Sellside Liquidity. Values approaching 100% imply price is trading close to the nearest Buyside Liquidity, while values approaching 0% imply price is trading close to Sellside Liquidity.
Users can also choose to show any of the above features on their current chart: FVGs, OBs, cumulative Market Structure, and Liquidity, all from the various selected timeframes.
發行說明
v1.1.0- Added Mean Threshold & Consequent Encroachment midpoint lines to Order Blocks and Fair Value Gaps, respectively
- Bug fixes
發行說明
v1.2.0- The Dashboard now indicates if price is in a POI by checking if the current candle (from high to low) has interacted with said POI in any way. This replaces the previous logic which required that the current close price must be within the upper and lower POI bounds
- POI will only be mitigated by the close price of its respective timeframe, rather than that of a lower (current chart) timeframe. For example, a 15m OB on a 1m chart will only be deleted once there is a decisive 15m close through its area
- The Dashboard will now display when price last encountered a given POI, using the POI's timeframe as a reference. For example, if the table cell for NQ1! 1D FVG says "H (3)", the "H" implies that NQ1! made a 1D high in or beyond a bearish 1D FVG, and traded away from it without mitigating it; and the "(3)" implies that this occurred 3 bars ago, on the 1D timeframe
發行說明
v1.2.1- Improved FVG and OB input sensitivity
發行說明
v1.2.2- Bug fixes regarding MTF Structure
發行說明
v1.3.0- Added Display POI Text option to annotate and distinguish the timeframe and POI type of an object, in addition to their unique colors
發行說明
v1.3.1- Bug fix regarding table sizes
發行說明
v1.3.2- Exporting all relevant factors to be usable in external indicators
發行說明
v1.3.3- Added transparency options for midlines and labels
發行說明
v1.4.0- Added POI options for OB flexibility and overall chart cleanup
發行說明
v1.4.1- Bug fix regarding certain POI when liquidity options are not utilized
發行說明
v1.5.0- Added POI Option to only show FVGs that create a BOS, MSS, or either
發行說明
v1.5.1- Bug fixes regarding FVG POI options
發行說明
v1.6.0- Added POI Mitigation option to specify how far price must close through a given FVG/OB in order to consider it mitigated
發行說明
v1.7.0- Added the option to display the time of the most recent MSS within the dashboard
- Added custom alert conditions when price reaches selected POI
發行說明
v1.8.0- Updated logic to be consistent with the Smart Money Essentials indicator
- Minor bug fixes
發行說明
v1.9.0- Added tooltips to help explain the Dashboard table cells
發行說明
Updated access instructions. No version change required發行說明
v1.9.1- Bug fix regarding FVG midline drawings
僅限邀請腳本
僅作者批准的使用者才能訪問此腳本。您需要申請並獲得使用許可,通常需在付款後才能取得。更多詳情,請依照作者以下的指示操作,或直接聯絡tradeforopp。
TradingView不建議在未完全信任作者並了解其運作方式的情況下購買或使用腳本。您也可以在我們的社群腳本中找到免費的開源替代方案。
作者的說明
Get access here: https://tradeforopp.com/
免責聲明
這些資訊和出版物並非旨在提供,也不構成TradingView提供或認可的任何形式的財務、投資、交易或其他類型的建議或推薦。請閱讀使用條款以了解更多資訊。
僅限邀請腳本
僅作者批准的使用者才能訪問此腳本。您需要申請並獲得使用許可,通常需在付款後才能取得。更多詳情,請依照作者以下的指示操作,或直接聯絡tradeforopp。
TradingView不建議在未完全信任作者並了解其運作方式的情況下購買或使用腳本。您也可以在我們的社群腳本中找到免費的開源替代方案。
作者的說明
Get access here: https://tradeforopp.com/
免責聲明
這些資訊和出版物並非旨在提供,也不構成TradingView提供或認可的任何形式的財務、投資、交易或其他類型的建議或推薦。請閱讀使用條款以了解更多資訊。