OPEN-SOURCE SCRIPT
已更新 Bollinger Bands %bb (normalised) & RSI
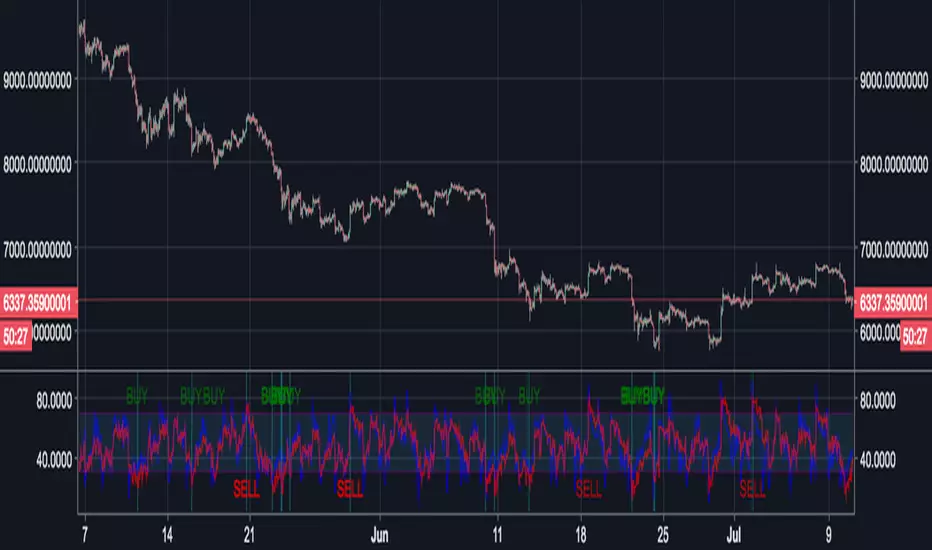
Indicator for displaying both Bollinger Bands %bb (normalised) and RSI simultaneously (Usual 0 - 1 range of BB normalised to the 30 - 70 range of RSI).
When both Bollinger Bands %bb and RSI are OB/OS then the column will turn blue and a buy/sell arrow will appear in the indicator provided other conditions pertaining to the OB/OS condition in one of the last two candles are also met.
I use this mainly for Cryptocurrencies for shorter time periods to indicate possible trade opportunities.
You could also set an alert on the arrow indicator appearing to auto trade.
發行說明
Changed colours so they are colourblind compliant.開源腳本
本著TradingView的真正精神,此腳本的創建者將其開源,以便交易者可以查看和驗證其功能。向作者致敬!雖然您可以免費使用它,但請記住,重新發佈程式碼必須遵守我們的網站規則。
免責聲明
這些資訊和出版物並不意味著也不構成TradingView提供或認可的金融、投資、交易或其他類型的意見或建議。請在使用條款閱讀更多資訊。
開源腳本
本著TradingView的真正精神,此腳本的創建者將其開源,以便交易者可以查看和驗證其功能。向作者致敬!雖然您可以免費使用它,但請記住,重新發佈程式碼必須遵守我們的網站規則。
免責聲明
這些資訊和出版物並不意味著也不構成TradingView提供或認可的金融、投資、交易或其他類型的意見或建議。請在使用條款閱讀更多資訊。