OPEN-SOURCE SCRIPT
Grid Indicator - The Quant Science
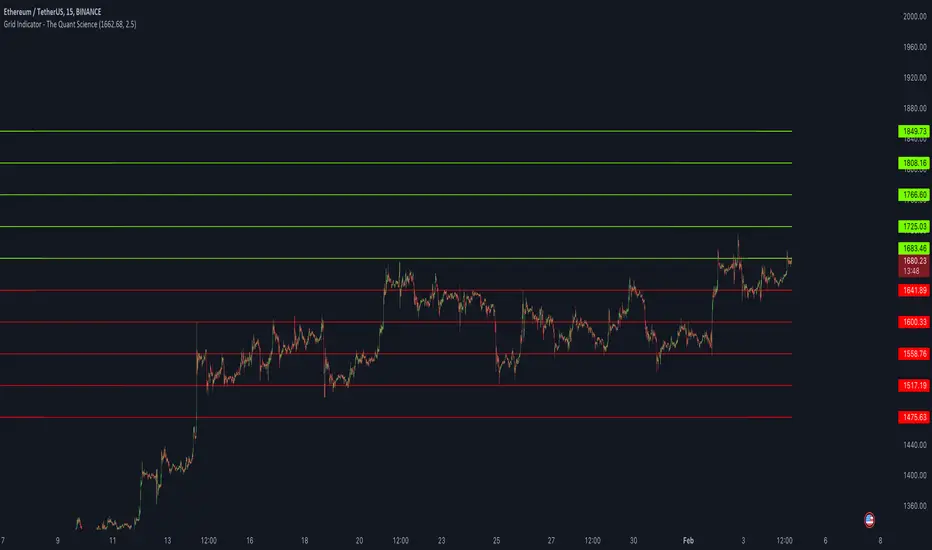
Quickly draw a 10-level grid on your chart with our open-source tool.
Our grid tool offers a unique solution to traders looking to maximize their profits in volatile market conditions. With its advanced features, you can create customized grids based on your preferred start price and line distance, allowing you to easily execute trades and capitalize on price movements. The tool works automatically, freeing up your time to focus on other important aspects of your trading strategy.
The benefits of using this tool are numerous. Firstly, it eliminates the need for manual calculation, making the analysis process much more efficient. Secondly, the automatic nature of the tool ensures that each grids are draw at precisely prices, giving you the best possible chance of maximizing your analysis. Finally, the ability to easily customize grids means that you can adapt your strategy quickly and effectively, even in rapidly changing market conditions.
So why wait? Take control of your trading and start using our innovative grid tool today! With its advanced features and ease of use, it's the perfect solution for traders of all levels looking to take their trading to the next level.
HOW TO USE
Using it is easy. Add the script to your chart and set the price and distance between the grids.
開源腳本
本著TradingView的真正精神,此腳本的創建者將其開源,以便交易者可以查看和驗證其功能。向作者致敬!雖然您可以免費使用它,但請記住,重新發佈程式碼必須遵守我們的網站規則。
免責聲明
這些資訊和出版物並不意味著也不構成TradingView提供或認可的金融、投資、交易或其他類型的意見或建議。請在使用條款閱讀更多資訊。
開源腳本
本著TradingView的真正精神,此腳本的創建者將其開源,以便交易者可以查看和驗證其功能。向作者致敬!雖然您可以免費使用它,但請記住,重新發佈程式碼必須遵守我們的網站規則。
免責聲明
這些資訊和出版物並不意味著也不構成TradingView提供或認可的金融、投資、交易或其他類型的意見或建議。請在使用條款閱讀更多資訊。