OPEN-SOURCE SCRIPT
已更新 Auto-Support v 0.2
Same script as the previous version with a slight twist
Have added (lines) "Transparency" to the settings to avoid having to edit every line individually ...
Cheers
Have added (lines) "Transparency" to the settings to avoid having to edit every line individually ...
Cheers
發行說明
*** Bug Fix version after today's error message issues ****Anyone using previous versions is strongly advised to update
> Removed some higher s/r levels from the code
> Sensitivity can now only be set between 1 - 10, higher numbers cause the script to fail to load
***********************************************************************
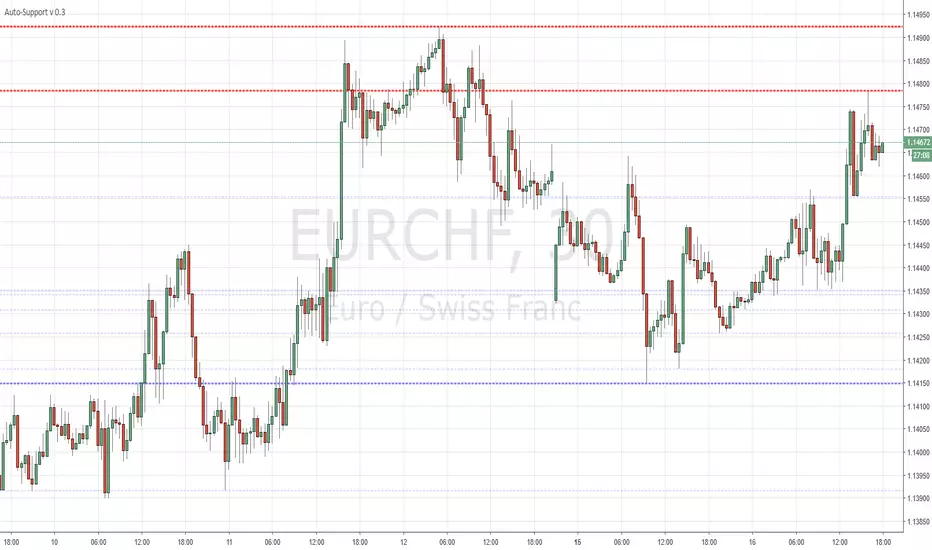
Fairly simple script that automatically draws highs and lows for the past X periods at various intervals.
3 Settings :
"Sensitivity" which amounts to the horizontal separation from one high to the next high (default multiplicator : 10)
"Transparency" ... Multiple lines piling up at the same level will cause the s/r levels to be more or less visible.
Variable "b" which is the HEX color for resistances (default : red)
Variable "c" which is the HEX color for supports (default : blue)
More HEX color codes on hexcolortool.com/ (not my webpage :)
Feel free to edit the script to your taste.
開源腳本
本著TradingView的真正精神,此腳本的創建者將其開源,以便交易者可以查看和驗證其功能。向作者致敬!雖然您可以免費使用它,但請記住,重新發佈程式碼必須遵守我們的網站規則。
免責聲明
這些資訊和出版物並不意味著也不構成TradingView提供或認可的金融、投資、交易或其他類型的意見或建議。請在使用條款閱讀更多資訊。
免責聲明
這些資訊和出版物並不意味著也不構成TradingView提供或認可的金融、投資、交易或其他類型的意見或建議。請在使用條款閱讀更多資訊。