OPEN-SOURCE SCRIPT
已更新 Determine Consecutive Candles

█ OVERVIEW
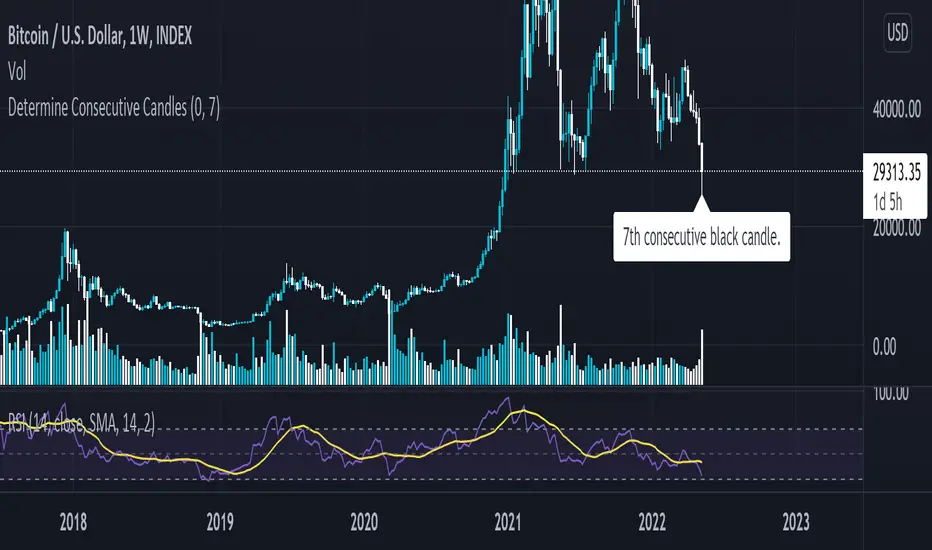
This is a simple script that will plot labels over or under candles to show where there had been consecutive candles that closed in a similar fashion. This script was inspired by a Tweet about Bitcoin experiencing its first 7th-consecutive weekly black candle and I sought out to test that.
█ INPUTS
There are three inputs for this script.
"offset" (integer) - (Can be 0 or 1) Allows the user to apply this script at the currently closing candle or the most recently closed candle.
"Number of Candles" (integer) - (From 3 to 100*) Allows the user to select how many candles to back test for consecutive-ness.
"Black or White" (boolean) - Allows the user to select what kinds of candles to look for in this script. (true - Black [close < open], false - White [close > open]).
*Publishing open-sourced, this selection was arbitrary and can be modified at will.
█ USAGE
Because I had created this in a little over an hour, this is just a simple experiment that I wanted to share with others. Its applications are unknown to me, but I am interested in hearing how others may find what this script does useful.
發行說明
Indicator name update發行說明
Chart update - reversion發行說明
Major re-work.Adjustments made: No longer uses function calls, instead all of the logic is implemented in the global scope instead (I found this to be much easier than trying to play around with historical references on function calls).
Alerts have been added, and this script has now been made to be adaptive. The "Number of Candles" (now called "Min Number of Candles") is instead a lower bound for detection, and this script will recognize the longest run of consecutive black or white candles to display overtop a label.
Detection for both types of runs is now supported, and bugs with the "On Close" offset have been fixed.
The alerts to be generated from this script will:
- Inform the user of an additional candle being added onto a run that meets the minimum number of candles.
- Inform the user when a run has ended.
Both of these alerts may be turned on or off individually.
發行說明
BUG FIXES: Ordinal indicators have been fixed (and absolved into its own function for re-use). There had been an issue where the ordinal indicators of 11, 12, and 13 had not been accounted for. The logic itself was also wrong; 31, 32, 33, 51, 52 ... would be given a "th" for their ordinal indicators (if ever displayed), they should now display properly.
FUNCTIONALITY UPDATE:
A fellow trader (yuip) approached me with an idea of adding support for detecting lower high and higher low runs. I took this idea one step further and also added the ability to detect higher high and lower low runs. Alerts for all 4 types of these runs have been added, and all may be turned on/off with boolean switches. Users now have the ability to disable the original function this script was meant to handle and focus on the runs specific to highs and lows.
DISPLAY CHANGES:
Along with the addition of other booleans to play around with, many of the inputs have now been put in representative groups for easier readability when using the options menu associated with this indicator.
Cheers.
發行說明
New Features: Index Offset
Show Counter Plots
The Index Offset integer will allow the user to specify which index to begin counting at. Default is 1, where the first candle in a run is considered candle '1', however this may be set so that the first candle in a run is identified as '0'. This applies to all types of runs.
The second feature introduced is more of a diagnostic feature. Show Counter Plots will allow the user to view how the variables used in this script to determine runs function. It is recommended that the indicator is moved to its own pane in order for this functionality to properly display. This will also remove all labels from the chart when enabled.
An example of the second feature can seen here (COINBASE:BTCUSD 1D):
開源腳本
秉持TradingView一貫精神,這個腳本的創作者將其設為開源,以便交易者檢視並驗證其功能。向作者致敬!您可以免費使用此腳本,但請注意,重新發佈代碼需遵守我們的社群規範。
免責聲明
這些資訊和出版物並非旨在提供,也不構成TradingView提供或認可的任何形式的財務、投資、交易或其他類型的建議或推薦。請閱讀使用條款以了解更多資訊。
開源腳本
秉持TradingView一貫精神,這個腳本的創作者將其設為開源,以便交易者檢視並驗證其功能。向作者致敬!您可以免費使用此腳本,但請注意,重新發佈代碼需遵守我們的社群規範。
免責聲明
這些資訊和出版物並非旨在提供,也不構成TradingView提供或認可的任何形式的財務、投資、交易或其他類型的建議或推薦。請閱讀使用條款以了解更多資訊。