INVITE-ONLY SCRIPT
RoseTree BTC Macro Liquidity
This indicator identies good entry and exit points for Bitcoin by comparing its market cap to the total global M2 money supply, while also factoring in macroeconomic trends.
Why It's Unique
- Combines macro liquidity (M2) with BTC valuation.
- Not price-based — more about where BTC stands in the bigger economic picture.
- Useful for long-term, macro-aware investors looking for timing signals aligned with monetary expansion.
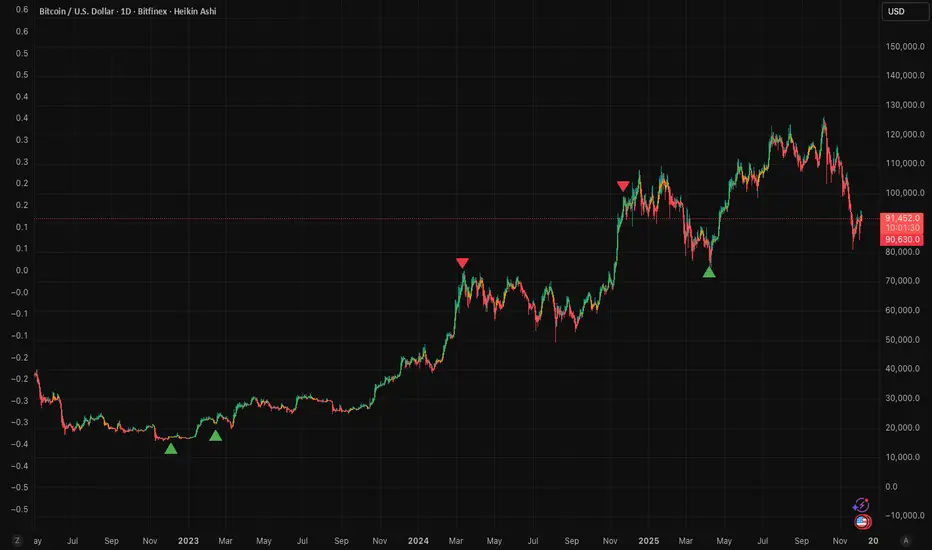
✅ Buy Signal (Green Triangle Below Bar)
M2 is expanding (liquidity increasing), AND
Bitcoin is undervalued compared to its historical relationship to M2
→ Suggests potential upside, triggers a green triangle below the bar.
❌ Sell Signal (Red Triangle Above Bar)
Bitcoin is significantly above its historical average share of M2
→ Suggests overvaluation or a short-term top, triggers a red triangle above the bar.
What is Global M2 Money Supply? (GLM2)
M2 is a measure of money supply, including cash, checking deposits, and easily convertible near money.
This indicator manually aggregates M2 values from numerous countries and converts them into USD equivalents using exchange rates.
The countries include the US, EU, UK, China, India, Japan, Brazil, and many others — totaling over 20.
This tells you how large Bitcoin is relative to the global money supply, giving a sense of its macroeconomic footprint or potential room to grow.
Why It's Unique
- Combines macro liquidity (M2) with BTC valuation.
- Not price-based — more about where BTC stands in the bigger economic picture.
- Useful for long-term, macro-aware investors looking for timing signals aligned with monetary expansion.
✅ Buy Signal (Green Triangle Below Bar)
M2 is expanding (liquidity increasing), AND
Bitcoin is undervalued compared to its historical relationship to M2
→ Suggests potential upside, triggers a green triangle below the bar.
❌ Sell Signal (Red Triangle Above Bar)
Bitcoin is significantly above its historical average share of M2
→ Suggests overvaluation or a short-term top, triggers a red triangle above the bar.
What is Global M2 Money Supply? (GLM2)
M2 is a measure of money supply, including cash, checking deposits, and easily convertible near money.
This indicator manually aggregates M2 values from numerous countries and converts them into USD equivalents using exchange rates.
The countries include the US, EU, UK, China, India, Japan, Brazil, and many others — totaling over 20.
This tells you how large Bitcoin is relative to the global money supply, giving a sense of its macroeconomic footprint or potential room to grow.
僅限邀請腳本
僅作者批准的使用者才能訪問此腳本。您需要申請並獲得使用許可,通常需在付款後才能取得。更多詳情,請依照作者以下的指示操作,或直接聯絡ZackBakos。
TradingView不建議在未完全信任作者並了解其運作方式的情況下購買或使用腳本。您也可以在我們的社群腳本中找到免費的開源替代方案。
作者的說明
To access this indicator, you must be a member of the RoseTree community. Visit rosetree.io to join, then DM me your username to receive access.
免責聲明
這些資訊和出版物並非旨在提供,也不構成TradingView提供或認可的任何形式的財務、投資、交易或其他類型的建議或推薦。請閱讀使用條款以了解更多資訊。