OPEN-SOURCE SCRIPT
Aroon Histogram + CMO [ChuckBanger]
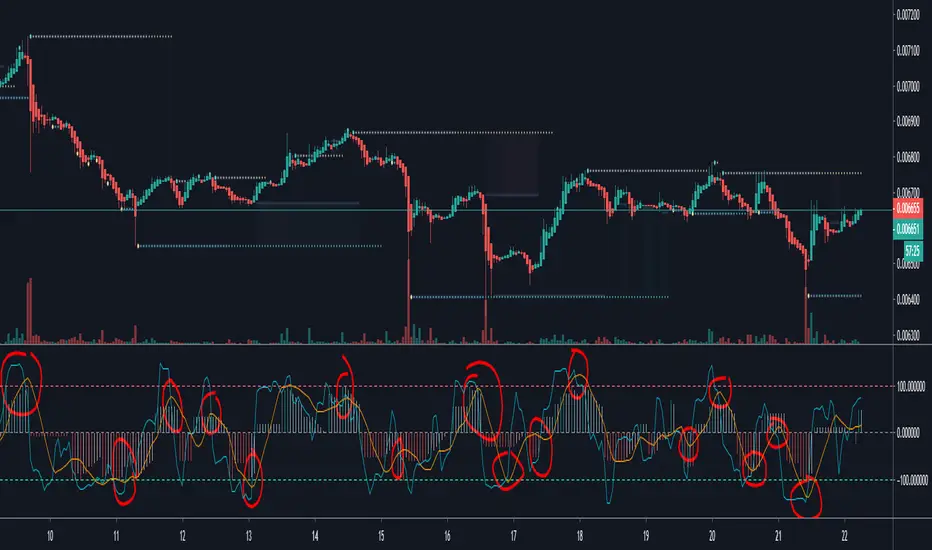
This is a combination of Aroon and Chande Momentum Oscillator . I made a histogram of Aroon , aqua line is Chande Momentum and the orange line are a simple moving average of Chande Momentum as a signal line.
One strategy you can use this for is to buy or sell when the signal line crosses the CM line or you can buy and sell when CM line is highest or lowest
You should also study how the indicators work separately:
Aroon Oscillator
investopedia.com/terms/a/aroonoscillator.asp
Chande Momentum Oscillator
investopedia.com/terms/c/chandemomentumoscillator.asp
開源腳本
本著TradingView的真正精神,此腳本的創建者將其開源,以便交易者可以查看和驗證其功能。向作者致敬!雖然您可以免費使用它,但請記住,重新發佈程式碼必須遵守我們的網站規則。
Tip jar, if you want to support my indicators work
BTC: 3EV8QGKK689kToo1r8pZJXbWDqzyJQtHy6
LTC: LRAikFVtnqY2ScJUR2ETJSG4w9t8LcmSdh
BTC: 3EV8QGKK689kToo1r8pZJXbWDqzyJQtHy6
LTC: LRAikFVtnqY2ScJUR2ETJSG4w9t8LcmSdh
免責聲明
這些資訊和出版物並不意味著也不構成TradingView提供或認可的金融、投資、交易或其他類型的意見或建議。請在使用條款閱讀更多資訊。