PROTECTED SOURCE SCRIPT
MATRIX Flow Chart V.3
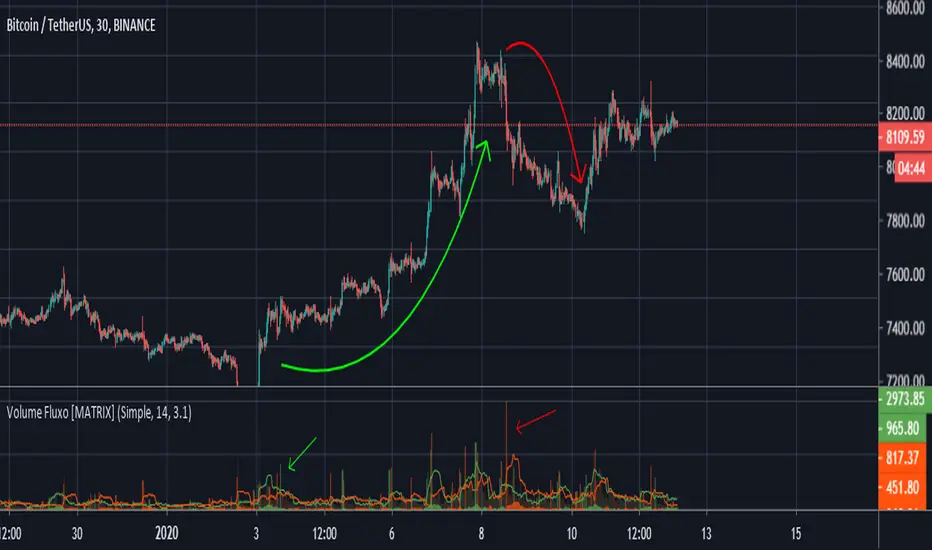
DepthHouse Volume Flow indicator is used to help determine trend direction strictly based on Negative and Positive volume data.
How to Read:
- Moving Average crossovers are used to help determine a possible trend change or retracement.
- The area cloud on the bottom is calculated by the difference of the moving averages. This could be used to help determine the trending volume strength.
- Bright colored volume bars are large volume spikes calculated by the x factor in the options.
Other changes:
- DepthHouse is going open source with numerous of its indicators. This is only one of many!
- Volume is now displayed without being altered for calculations.
O indicador de fluxo de volume DepthHouse é usado para ajudar a determinar a direção da tendência estritamente com base nos dados de volume negativo e positivo.
Como ler:
- Média móvel crossovers são usados para ajudar a determinar uma possível mudança ou retração de tendência.
- A nuvem da área na parte inferior é calculada pela diferença das médias móveis. Isso pode ser usado para ajudar a determinar a força do volume de tendências.
- Barras de volume coloridas brilhantes são grandes picos de volume calculados pelo fator x nas opções.
受保護腳本
此腳本以閉源形式發佈。 不過,您可以自由使用,沒有任何限制 — 點擊此處了解更多。
免責聲明
這些資訊和出版物並非旨在提供,也不構成TradingView提供或認可的任何形式的財務、投資、交易或其他類型的建議或推薦。請閱讀使用條款以了解更多資訊。
受保護腳本
此腳本以閉源形式發佈。 不過,您可以自由使用,沒有任何限制 — 點擊此處了解更多。
免責聲明
這些資訊和出版物並非旨在提供,也不構成TradingView提供或認可的任何形式的財務、投資、交易或其他類型的建議或推薦。請閱讀使用條款以了解更多資訊。