OPEN-SOURCE SCRIPT
已更新 Multi timeframe Stochastic RSI Screener by noop42

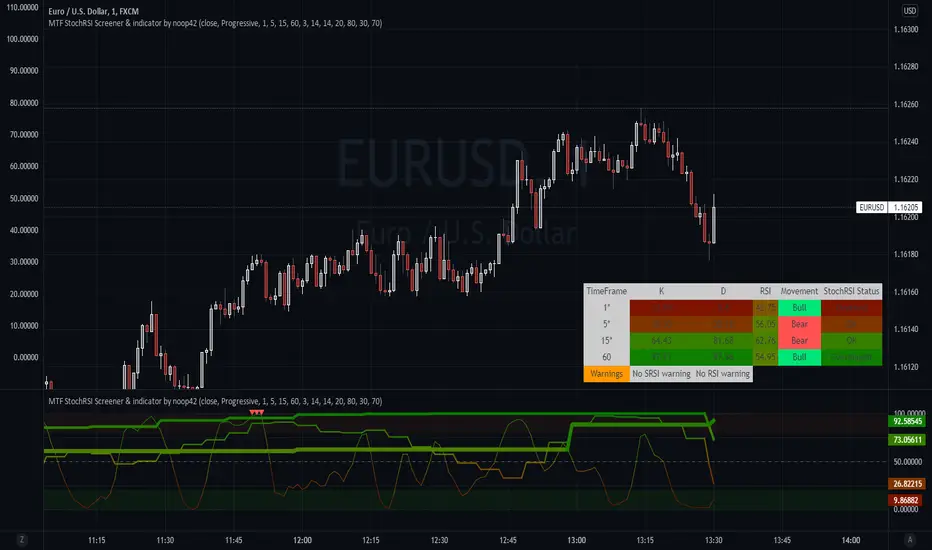
Here is a custom x4 timeframes Stochastic RSI screener to add on your charts.
Options
Default parameters
Notes
Use the lowest timeframe configured on the screener to get real values
A classic x3 multi-timeframe Stochastic RSI indicator is also available https://fr.tradingview.com/script/OwRzXzIb/
Options
- Repaint mode : if enabled: values are updated in live, if disabled: values are updated once the concerned candle is closed
Default parameters
- Timeframes: 1, 5, 15, 60
- Repaint mode: enabled
Notes
Use the lowest timeframe configured on the screener to get real values
A classic x3 multi-timeframe Stochastic RSI indicator is also available https://fr.tradingview.com/script/OwRzXzIb/
發行說明
This update includes the indicator and the screener I previously developed.Updates:
- The oscillator prints the fourth timeframe which have already been included in the screener
- The screener is now including a warning field to show overbought/oversold signals convergence, which could indicate an incoming movement reversal (Warnings are calculated on the three lowest timeframes (the highest is ignored))
- Warnings are calculated on the three lowest timeframes (the highest is ignored)
- The screener can be disabled
- Overbought and Oversold signals are now based on the average value between K and D lines
- Up and Down triangles have been added to the oscillator to show OB/OS convergences
- Visual improvements
Note: This is an indicator, not a complete and trustable strategy
Hope you'll enjoy it :)
發行說明
Updates- A column showing each timeframe's RSI value has been added to the screener
- Floating values have been limited to only 2 digits after the comma
- A second warning field concerning the three lowest timeframes' RSI have been added to show OB/OS convergences
發行說明
Update- New option to select which timeframe(s) must be taken into consideration for convergence signals (Selected timeframes can be distinguished in the screener, followed by a * char in the timeframes column).
- If you plan to use the screener only and to move it on your main chart, you can now disable displays of stochastic rsi lines and zones. (thx to EtCrt for the idea)
發行說明
Updates- A new color mode has been added. When enabled, it automatically apply the appropriate color from green to red (on the screener, and also on lines when the average mode is enabled). This is the new default color mode.
- Converted to Pinescript v5
開源腳本
本著TradingView的真正精神,此腳本的創建者將其開源,以便交易者可以查看和驗證其功能。向作者致敬!雖然您可以免費使用它,但請記住,重新發佈程式碼必須遵守我們的網站規則。
免責聲明
這些資訊和出版物並不意味著也不構成TradingView提供或認可的金融、投資、交易或其他類型的意見或建議。請在使用條款閱讀更多資訊。
開源腳本
本著TradingView的真正精神,此腳本的創建者將其開源,以便交易者可以查看和驗證其功能。向作者致敬!雖然您可以免費使用它,但請記住,重新發佈程式碼必須遵守我們的網站規則。
免責聲明
這些資訊和出版物並不意味著也不構成TradingView提供或認可的金融、投資、交易或其他類型的意見或建議。請在使用條款閱讀更多資訊。