OPEN-SOURCE SCRIPT
Date-selected Synch and Compare Script Module [yoxxx]
This Script is a Convenience Script Module for calculations based or started on a fix time / date.
(In difference to bar_index-based where the reference point is shifting from bar to bar, thus is dynamic).
Purpose examples:
- Comparison by start date
- Time driven studies or strategies
- Measuring from Date of Interest
The script also contains a date input box with the feature of auto-converting the default time to local user time (a newer feature of Tradingview which too me a lot of research to find; so here integrated).
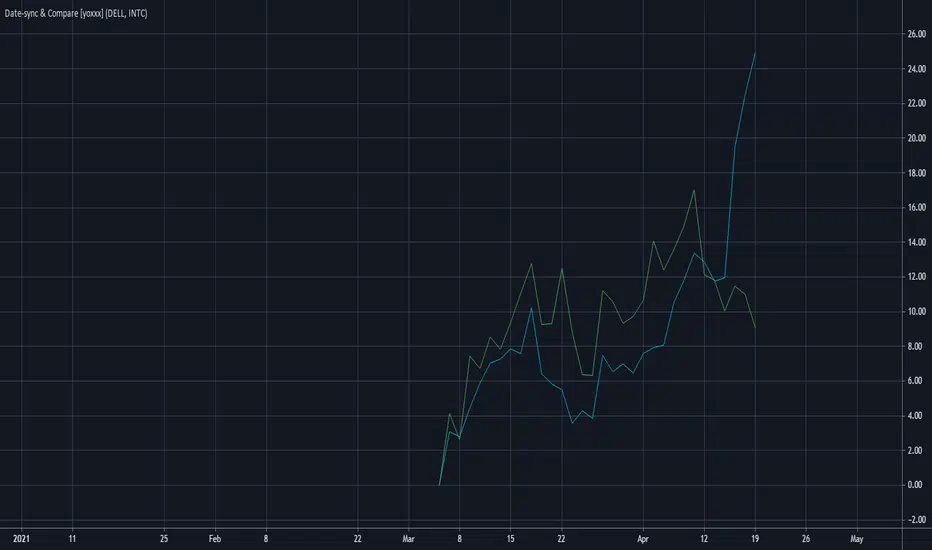
Last not least it the module gives you a ready to go example for multi security comparison on percentage scale with a free selectable start date.
Enjoy
Yoxxx
P.S:. For further notes look at the script code.
They are concerning usage and how avoiding some strange display issues.
(In difference to bar_index-based where the reference point is shifting from bar to bar, thus is dynamic).
Purpose examples:
- Comparison by start date
- Time driven studies or strategies
- Measuring from Date of Interest
The script also contains a date input box with the feature of auto-converting the default time to local user time (a newer feature of Tradingview which too me a lot of research to find; so here integrated).
Last not least it the module gives you a ready to go example for multi security comparison on percentage scale with a free selectable start date.
Enjoy
Yoxxx
P.S:. For further notes look at the script code.
They are concerning usage and how avoiding some strange display issues.
開源腳本
本著TradingView的真正精神,此腳本的創建者將其開源,以便交易者可以查看和驗證其功能。向作者致敬!雖然您可以免費使用它,但請記住,重新發佈程式碼必須遵守我們的網站規則。
免責聲明
這些資訊和出版物並不意味著也不構成TradingView提供或認可的金融、投資、交易或其他類型的意見或建議。請在使用條款閱讀更多資訊。
開源腳本
本著TradingView的真正精神,此腳本的創建者將其開源,以便交易者可以查看和驗證其功能。向作者致敬!雖然您可以免費使用它,但請記住,重新發佈程式碼必須遵守我們的網站規則。
免責聲明
這些資訊和出版物並不意味著也不構成TradingView提供或認可的金融、投資、交易或其他類型的意見或建議。請在使用條款閱讀更多資訊。