INVITE-ONLY SCRIPT
已更新 Power Block Consolidation with Volume @MaxMaserati 2.0
Power Block Consolidation with Volume MaxMaserati 2.0
Overview
Price action hinges on consolidation, the foundation of market moves. The "Power Block Consolidation with Volume MaxMaserati 2.0" (MMPB) indicator uses a proprietary, ingenious system to identify high-probability consolidation zones—termed "power blocks"—where smart money drives accumulation or distribution. By leveraging a unique limitorphe closing candle system, to plots volume to signal price direction: significant volume at the high price indicates bullish continuation, while volume at the low price suggests bearish momentum. This tool empowers traders to exploit bullish and bearish trends with precision.
Key Features
Consolidation Detection: Pinpoints power blocks using a secret system, marking zones of smart money activity.
Volume Analysis: A proprietary limitrophe closing candle system splits volume into buying (high price) and selling (low price), revealing accumulation (buying pressure) or distribution (selling pressure).
Trend Visualization:
Bullish Trends: Green boxes and lines highlight consolidation zones with high volume at the high price, signaling upward continuation.
Bearish Trends: Red boxes and lines mark zones with high volume at the low price, indicating downward momentum.
NB: The volume matter more than the color of the box.
Example
High volume up at the box vs low volume at the low we expect an up move

Even we had a bearish Body close below the box price reconfirmed the up move

Price make the bullish upside move

Price retest the box and reject it strongly

Breakout and Retest: Captures breakouts from power blocks, with price often retesting the zone before resuming the trend.
Volume Labels: Displays buying (green) and selling (red) volume on lines for clear pressure analysis.
Breakout Alerts: Triggers alerts for bullish ("BuBC") and bearish ("BeBC") breakouts, with optional visual markers (triangles).
Strategy
MMPB is designed to capture smart money behavior in consolidation zones, where markets prepare for significant moves. Key principles:
Volume-Driven Direction: High volume at the high price within a power block signals strong bullish continuation; high volume at the low price indicates bearish potential.
Accumulation/Distribution: Buying volume reflects accumulation, priming bullish trends; selling volume signals distribution, fueling bearish trends.
Breakout and Retest: Price often breaks out from power blocks and retests the zone, offering low-risk entry points.
Consolidation as Precursor: Markets require consolidation to build momentum, making power blocks critical for trend prediction.
Traders can:
Enter on breakouts with strong volume confirmation.
Target retests of power blocks for high-probability setups.
Use volume labels to assess trend strength.
Use Cases
Trend Trading: Ride bullish or bearish trends post-breakout from high-volume power blocks.
Swing Trading: Use power blocks as dynamic support/resistance for entries and exits.
Smart Money Analysis: Identify accumulation (bullish) or distribution (bearish) zones.
Risk Management: Place stops at power block edges during retests.
Conclusion
The MMPB indicator, powered by a proprietary system, transforms consolidation analysis by identifying power blocks where smart money operates. Its limitrophe closing candle system highlights volume-driven trends, enabling traders to capitalize on bullish and bearish moves with confidence. Ideal for trend and swing traders, MMPB shines in markets where consolidation precedes significant trends, offering clear signals for breakouts and retests.
Overview
Price action hinges on consolidation, the foundation of market moves. The "Power Block Consolidation with Volume MaxMaserati 2.0" (MMPB) indicator uses a proprietary, ingenious system to identify high-probability consolidation zones—termed "power blocks"—where smart money drives accumulation or distribution. By leveraging a unique limitorphe closing candle system, to plots volume to signal price direction: significant volume at the high price indicates bullish continuation, while volume at the low price suggests bearish momentum. This tool empowers traders to exploit bullish and bearish trends with precision.
Key Features
Consolidation Detection: Pinpoints power blocks using a secret system, marking zones of smart money activity.
Volume Analysis: A proprietary limitrophe closing candle system splits volume into buying (high price) and selling (low price), revealing accumulation (buying pressure) or distribution (selling pressure).
Trend Visualization:
Bullish Trends: Green boxes and lines highlight consolidation zones with high volume at the high price, signaling upward continuation.
Bearish Trends: Red boxes and lines mark zones with high volume at the low price, indicating downward momentum.
NB: The volume matter more than the color of the box.
Example
High volume up at the box vs low volume at the low we expect an up move
Even we had a bearish Body close below the box price reconfirmed the up move
Price make the bullish upside move
Price retest the box and reject it strongly
Breakout and Retest: Captures breakouts from power blocks, with price often retesting the zone before resuming the trend.
Volume Labels: Displays buying (green) and selling (red) volume on lines for clear pressure analysis.
Breakout Alerts: Triggers alerts for bullish ("BuBC") and bearish ("BeBC") breakouts, with optional visual markers (triangles).
Strategy
MMPB is designed to capture smart money behavior in consolidation zones, where markets prepare for significant moves. Key principles:
Volume-Driven Direction: High volume at the high price within a power block signals strong bullish continuation; high volume at the low price indicates bearish potential.
Accumulation/Distribution: Buying volume reflects accumulation, priming bullish trends; selling volume signals distribution, fueling bearish trends.
Breakout and Retest: Price often breaks out from power blocks and retests the zone, offering low-risk entry points.
Consolidation as Precursor: Markets require consolidation to build momentum, making power blocks critical for trend prediction.
Traders can:
Enter on breakouts with strong volume confirmation.
Target retests of power blocks for high-probability setups.
Use volume labels to assess trend strength.
Use Cases
Trend Trading: Ride bullish or bearish trends post-breakout from high-volume power blocks.
Swing Trading: Use power blocks as dynamic support/resistance for entries and exits.
Smart Money Analysis: Identify accumulation (bullish) or distribution (bearish) zones.
Risk Management: Place stops at power block edges during retests.
Conclusion
The MMPB indicator, powered by a proprietary system, transforms consolidation analysis by identifying power blocks where smart money operates. Its limitrophe closing candle system highlights volume-driven trends, enabling traders to capitalize on bullish and bearish moves with confidence. Ideal for trend and swing traders, MMPB shines in markets where consolidation precedes significant trends, offering clear signals for breakouts and retests.
發行說明
## OverviewThe MMM Super Momentum & Bias indicator is a powerful technical analysis tool that combines volume analysis with momentum signals to identify market trends and potential reversal points. It utilizes volume distribution, HVCN (Highest Volume Candle Node), and the MMPD (Premium and Discount) to establish the bias lines that defines the market direction, and specifically, the momentum lines provide confirmation and early warning signals of trend changes. It can be use to exit at the best places and enter at the best places with high precision.
## Main Features
### MMM Main Bias Line
This is the core component of the indicator, calculated using volume distribution analysis to identify the price level where the highest trading volume occurs. This line serves as the primary market divider:
- **Price above the Main Bias Line**: Bullish market condition
- **Price below the Main Bias Line**: Bearish market condition
- **Triangles**: Appear when price crosses the bias line, signaling potential trend changes
### MMM Volumes Momentum
The momentum lines work in conjunction with the main bias line to provide deeper market insights:
- **Green momentum lines**: Bullish momentum
- **Line turns black while price is above bias line**: Shallow pullback, maintain bullish bias
- **Line turns red while price is above bias line**: Deep pullback, caution advised
- **Red momentum lines**: Bearish momentum
- **Line turns black while price is below bias line**: Shallow rally, maintain bearish bias
- **Line turns green while price is below bias line**: Strong rally, potential trend reversal
### Multi-Factor Signal Table
The indicator features a comprehensive signal table that displays:
1. **Timeframe Information**: Shows the current chart timeframe and analysis timeframe
2. **Market Bias**: Bullish, Bearish, or Neutral based on multiple factors
3. **Signal Strength**: Measured on a 1-4 scale, with higher numbers indicating stronger signals
4. **Component Breakdown**: Displays the status of four key components:
- **M**: Momentum (crossovers between momentum lines)
- **V**: Volatility (price position relative to bands)
- **T**: Trend (direction of momentum filter)
- **P**: Price (relationship to momentum line)
## How to Use
1. **Identify Market Bias**:
- When price is above the MMM Main Bias Line, the market has a bullish bias
- When price is below the MMM Main Bias Line, the market has a bearish bias
2. **Confirm with Momentum Lines**:
- In bullish markets, look for green momentum lines for continuation
- In bearish markets, look for red momentum lines for continuation
- Watch for color changes as early warning signals
3. **Monitor Signal Strength**:
- Higher strength values (3-4) indicate stronger, more reliable signals
- Pay attention to component breakdowns for additional insights
4. **Trade the Crossovers**:
- Triangle indicators mark key points where price crosses the bias line
- These often represent significant trading opportunities
## Customization Options
- Show/hide each component independently
- Adjust colors for bullish and bearish signals
- Customize the table position and transparency
- Fine-tune volume analysis parameters
- Select from multiple moving average types for momentum calculation
This indicator combines the power of volume analysis with momentum studies to provide a comprehensive market view, helping traders identify high-probability trading opportunities across all timeframes.
發行說明
-Consolidation labels added- Precise Break-out labels/symbol added
- Bug fix
發行說明
- Midline added which will help to spot the retest after a break-out發行說明
- OLD: Box color based on candle direction- NEW:
Green = ACCUMULATION (buying pressure dominant)
Red = DISTRIBUTION (selling pressure dominant)
Real-time updates as volume accumulates
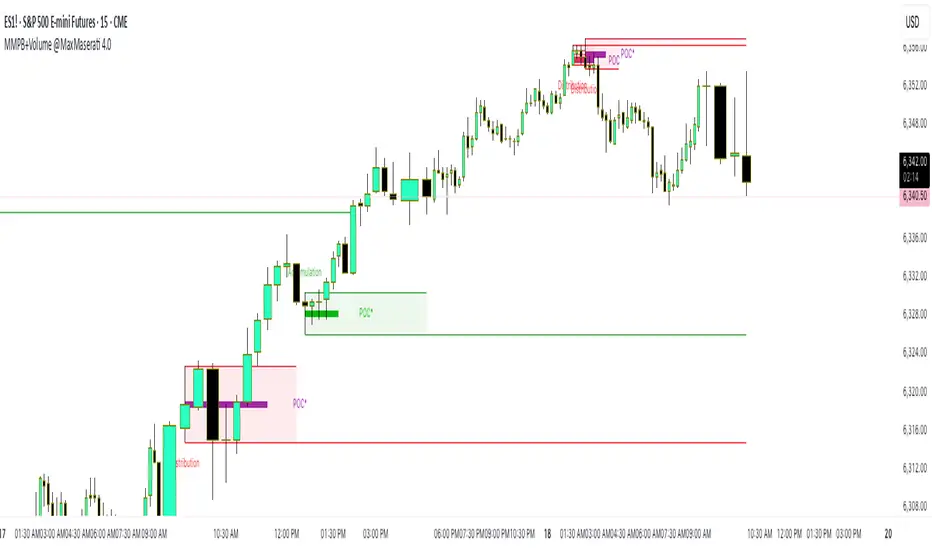
- Volume Imprint Profile
Displays volume bars within boxes, highlighting significant volume distribution at each price level.
- POC (Point of Control)
Dynamic lines marking the highest volume price within each box.
- Flip Detection / Reversal Signals
Bullish Flip: Distribution (red) box breaks upward → potential reversal signal.
Bearish Flip: Accumulation (green) box breaks downward → potential reversal signal.
Clear visual borders & labels for easy identification.
- Only green (accumulation) & red (distribution) boxes—no more grey.
Volume profile filtering ensures only the most significant boxes are shown.
僅限邀請腳本
僅作者批准的使用者才能訪問此腳本。您需要申請並獲得使用許可,通常需在付款後才能取得。更多詳情,請依照作者以下的指示操作,或直接聯絡MaxMaserati。
TradingView不建議在未完全信任作者並了解其運作方式的情況下購買或使用腳本。您也可以在我們的社群腳本中找到免費的開源替代方案。
作者的說明
This indicator is part of the MaxMaserati Model 2.0, please go on Whop for access. An explanation video will be provided as well.
https://whop.com/checkout/plan_miLEM4YBeYsXc?d2c=true
MMM : No body close (PO4), No Trade.
免責聲明
這些資訊和出版物並非旨在提供,也不構成TradingView提供或認可的任何形式的財務、投資、交易或其他類型的建議或推薦。請閱讀使用條款以了解更多資訊。