PROTECTED SOURCE SCRIPT
Premium/Discount with Candle Open stats [Herman]
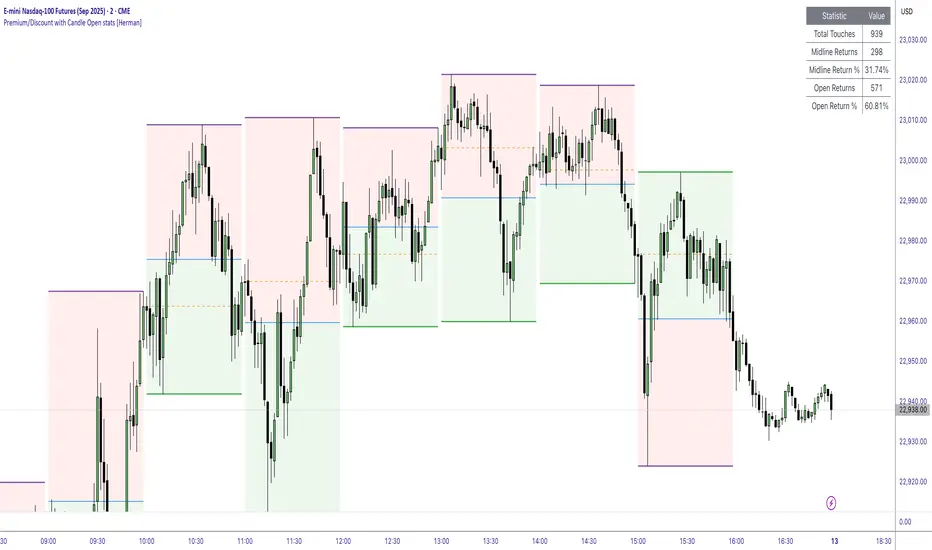
Premium/Discount with Stats [Herman]
This indicator is designed to help traders identify and analyze premium/discount zones on any timeframe while automatically tracking statistics on price behavior relative to these zones. It is especially valuable for traders looking to structure entries, manage targets, and quantify market reactions to prior session ranges.
What it draws on the chart
✅ Range High and Low Lines
For each selected timeframe period (15min, 30min 1H, 4H, Daily), the indicator plots the high and low of the completed previous period.
These lines are color-coded dynamically based on sweep detection:
If the high was swept (price broke the previous high), the high line is marked as Premium.
If the low was swept, the low line is marked as Discount.
If both were swept or neither, it uses the default color settings.
✅ Midline
An optional midline at the 50% level of the previous period’s high-low range.
Helpful for mean-reversion traders or anyone watching for retests of equilibrium.
✅ Quartile Lines (25%–75%)
Optional additional lines at 25% and 75% of the previous range, helping traders visualize inner range subdivisions.
✅ Open Price Line
Marks the open price of the previous period as a horizontal reference.
✅ Background Fills
The region between low and midline is shaded with the Discount color.
The region between high and midline is shaded with the Premium color.
These optional fills help highlight the premium and discount zones visually.
✅ Current Incomplete Period Lines (optional)
You can choose to display provisional high, low, midline, quartiles, and open for the current forming period.
These update in real-time until the period closes.
Sweep Detection Logic
The indicator automatically tracks if the current period price sweeps above the previous period’s high or below the low.
A "sweep" is simply defined as price exceeding the previous high/low while tracking is active.
The sweep status affects the colors of the premium/discount lines, helping traders see potential liquidity grabs or stop hunts.
What it counts and tracks (Statistics)
The script automatically compiles statistics over time:
✅ Total Touches
Counts how many times the price in a new period touches either the previous period’s high or low.
A “touch” is registered once per side per period.
✅ Midline Returns
Counts how often, after touching the previous high/low, price returns to the previous period’s midline.
Gives you a measure of mean-reversion success.
✅ Open Returns
Similarly, tracks how often price returns to the previous period’s open after touching the previous high/low.
✅ Return Percentages
Displays the percentage of touches that result in a return to midline or open.
These percentages are calculated live on your chart and updated after each period closes.
✅ Stats Table
A customizable on-chart table summarizing all of these stats in real-time.
Helps traders evaluate the effectiveness of range-based trading setups over time.
How it Works (Technical details)
On each new bar, the script checks if a new period (as defined by your timeframe selection) has begun.
When a new period starts, the previous period’s high, low, open, midline, quartiles are recorded and drawn on the chart.
The script then “watches” the current period:
Updates provisional high and low.
Detects sweeps of previous highs/lows.
Tracks if price returns to the previous period’s midline or open after those sweeps.
Increments statistical counters if conditions are met.
Background fills and lines update dynamically based on real-time data.
Intended Use Cases
This indicator is ideal for:
✅ Identifying premium/discount zones for swing or intraday trades.
✅ Spotting liquidity sweeps and possible manipulation zones.
✅ Structuring trades with logical, data-driven target zones (midline, open).
✅ Quantifying the probability of mean-reversion moves after liquidity events.
✅ Developing and backtesting range-based trading models with live stats.
Highly Customizable
Choose any timeframe for defining the premium/discount range.
Toggle visibility of midline, quartiles, open line, current period preview.
Full control over colors, line styles, line widths, and background shading.
Optional real-time statistical table with total counts and return percentages.
受保護腳本
此腳本以閉源形式發佈。 不過,您可以自由使用,沒有任何限制 — 點擊此處了解更多。
免責聲明
這些資訊和出版物並非旨在提供,也不構成TradingView提供或認可的任何形式的財務、投資、交易或其他類型的建議或推薦。請閱讀使用條款以了解更多資訊。
免責聲明
這些資訊和出版物並非旨在提供,也不構成TradingView提供或認可的任何形式的財務、投資、交易或其他類型的建議或推薦。請閱讀使用條款以了解更多資訊。