OPEN-SOURCE SCRIPT
已更新 Tabular Portfolio by CJS V1
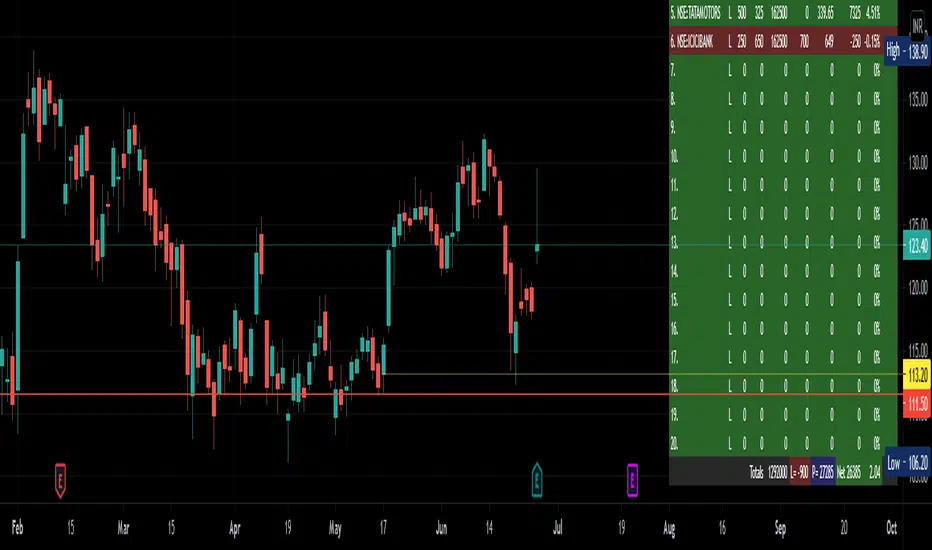
This is a useful indicator that sits on top of the charts, in the right hand bottom corner and shows the current price, profit or loss in value and percent of upto 20 scrips fed in, in a Tabular form using tables feature.
Allows to mark a/c id also if you have multiple broker or individual accounts.
Colors are customisable.
Stocks get updated no matter what is your current selected scrip.
Gives total investment and total PnL also in percent.
Useful to monitor your portfolio status in once screen and while you are looking at charts.
Give feedback for improvement or issues, if any.
Credits to RedKTrader from where the idea was picked up.
Move visual order to front, if the charts and other indicators overlap the table view.
發行說明
This is a useful indicator that sits on top of the charts, in the right hand bottom corner and shows the current price, profit or loss in value and percent of upto 20 scrips fed in, in a Tabular form using tables feature.Allows to mark a/c id also if you have multiple broker or individual accounts.
Colors are customisable.
Stocks get updated no matter what is your current selected scrip.
Gives total investment and total PnL also in percent.
Useful to monitor your portfolio status in once screen and while you are looking at charts.
Give feedback for improvement or issues, if any.
Credits to RedKTrader from where the idea was picked up.
Move visual order to front, if the charts and other indicators overlap the table view.
發行說明
- Some bugs removed.- Total PnL in case of short entries was wrong - corrected.
Added the following features:
1. A target price field added. The line turns blue when this target is achieved, signalling to book profit.
2. If no target is defined, there is a global profit, which when achieved, the line turns blue to signal to book profit. (only for those where target price is zero)
3. Amount invested in each scrip is shown (for Cash segment). For FnO, do your own judgement whether you consider to consider Margin / premium as invested amount or not. Basically shows total exposure.
4. Totals show bookable current profit of all positive PnLs in blue field (marked "P=" and total loss of all negative PnL in red field (marked "L=". Net PnL was as such being shown.
發行說明
with a data populated image...開源腳本
秉持TradingView一貫精神,這個腳本的創作者將其設為開源,以便交易者檢視並驗證其功能。向作者致敬!您可以免費使用此腳本,但請注意,重新發佈代碼需遵守我們的社群規範。
免責聲明
這些資訊和出版物並非旨在提供,也不構成TradingView提供或認可的任何形式的財務、投資、交易或其他類型的建議或推薦。請閱讀使用條款以了解更多資訊。
免責聲明
這些資訊和出版物並非旨在提供,也不構成TradingView提供或認可的任何形式的財務、投資、交易或其他類型的建議或推薦。請閱讀使用條款以了解更多資訊。