OPEN-SOURCE SCRIPT
已更新 MACD MTF Lines
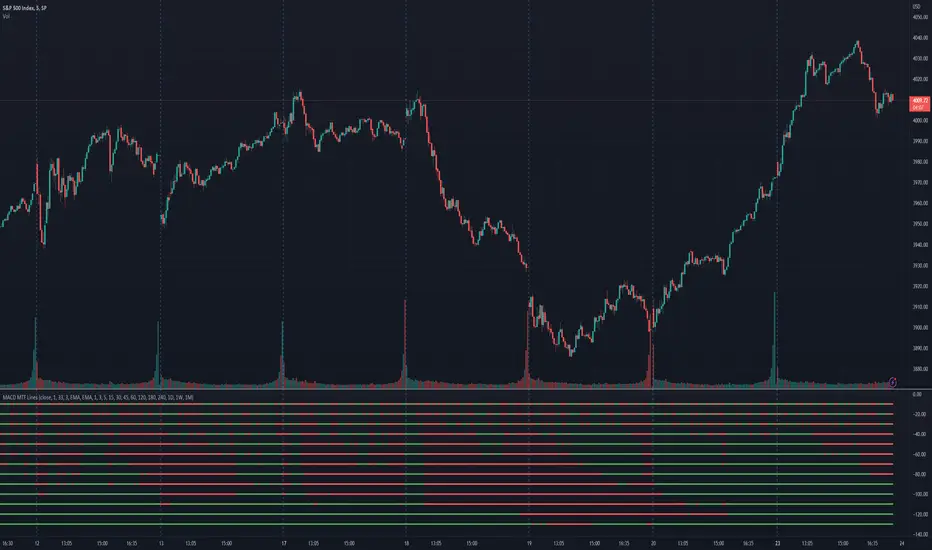
The indicator shows the MACD histogram sign (positive or negative) for several timeframes at once. You can see at a glance how the price is trending across higher and lower timeframes.
The code uses recursive calculations for the SMA and EMA to avoid lookahead errors and repainting on higher timeframes.
Note that, for lower timeframes, the line becomes yellow to the left because history is limited and there are not enough bars to calculate.
The code uses recursive calculations for the SMA and EMA to avoid lookahead errors and repainting on higher timeframes.
Note that, for lower timeframes, the line becomes yellow to the left because history is limited and there are not enough bars to calculate.
發行說明
The indicator was updated to show the maximum number of lines supported.發行說明
Each line can be enabled or disabled individually, so that unused ones can be hidden.發行說明
Added simple trend detection based on the number of bullish and bearish timeframes; threshold can be changed in Settings.Added data outputs:
* "Score": counting the net number of bullish and bearish timeframes
* "Trend": changes to bullish or bearish as the score goes over or under the threshold
Added background color (green or red according to trend); can be enabled in Settings.
Added alert for trend change.
Fix: named individual timeframe outputs.
發行說明
Added another alert with a separate threshold score for flexibility.發行說明
Fix: minimum values set to 1.發行說明
Added score weights for further customization of trend detection and alerts. Input parameters are now set in terms of score values instead of number of lines.發行說明
Release notes:Added input options to choose alert modes for trend and extra alerts. The options are:
* once per bar close (default)
* once per bar
* every time
開源腳本
秉持TradingView一貫精神,這個腳本的創作者將其設為開源,以便交易者檢視並驗證其功能。向作者致敬!您可以免費使用此腳本,但請注意,重新發佈代碼需遵守我們的社群規範。
免責聲明
這些資訊和出版物並非旨在提供,也不構成TradingView提供或認可的任何形式的財務、投資、交易或其他類型的建議或推薦。請閱讀使用條款以了解更多資訊。
開源腳本
秉持TradingView一貫精神,這個腳本的創作者將其設為開源,以便交易者檢視並驗證其功能。向作者致敬!您可以免費使用此腳本,但請注意,重新發佈代碼需遵守我們的社群規範。
免責聲明
這些資訊和出版物並非旨在提供,也不構成TradingView提供或認可的任何形式的財務、投資、交易或其他類型的建議或推薦。請閱讀使用條款以了解更多資訊。