PROTECTED SOURCE SCRIPT
已更新 MTF RSI Channel Smoothed (Linear Regression)
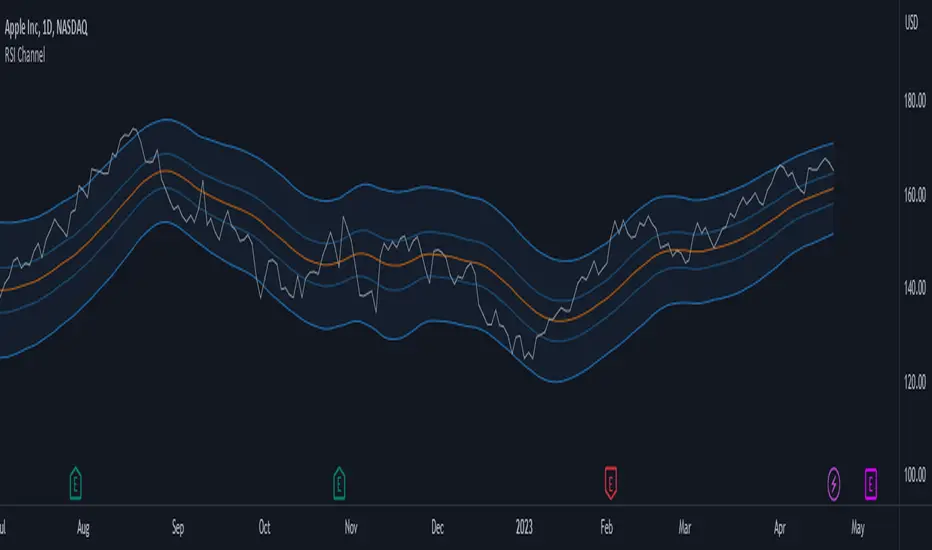
The "MTF RSI Channel Smoothed (Linear Regression)" indicator is a momentum oscillator that displays smoothed RSI bands across multiple timeframes.
What sets this indicator apart is that it uses linear regression to smooth the RSI bands. Linear regression is a statistical technique that helps filter out the noise in the data, resulting in smoother and more precise RSI bands. This provides traders with a more advanced and reliable tool for monitoring the RSI bands across multiple timeframes.
One of the primary advantages of using linear regression to smooth the RSI bands is that it provides a more accurate and reliable way to identify overbought and oversold levels of the asset. The linear regression method smooths out the data by reducing the impact of temporary price fluctuations, allowing traders to see the underlying trend more clearly. This helps traders to make more informed trading decisions by identifying key levels of support and resistance, and spotting potential entry and exit points.
Another advantage of the "Multi-Timeframe Smoothed RSI Bands" indicator is that it allows traders to adjust the length of the smoothing period using the "Smooth Period" parameter. This flexibility gives traders the ability to fine-tune the indicator to their specific trading style and preferences, resulting in a more personalized and effective trading tool.
Overall, the "Multi-Timeframe Smoothed RSI Bands" indicator is a powerful tool for traders looking to monitor the RSI bands across multiple timeframes. By using linear regression to smooth the data, this indicator provides traders with a more accurate and reliable way to identify potential trading opportunities, and make more informed trading decisions.
發行說明
minor changes受保護腳本
此腳本以閉源形式發佈。 不過,您可以自由使用,沒有任何限制 — 點擊此處了解更多。
Plan the trade ⚡ Trade the plan
免責聲明
這些資訊和出版物並非旨在提供,也不構成TradingView提供或認可的任何形式的財務、投資、交易或其他類型的建議或推薦。請閱讀使用條款以了解更多資訊。
受保護腳本
此腳本以閉源形式發佈。 不過,您可以自由使用,沒有任何限制 — 點擊此處了解更多。
Plan the trade ⚡ Trade the plan
免責聲明
這些資訊和出版物並非旨在提供,也不構成TradingView提供或認可的任何形式的財務、投資、交易或其他類型的建議或推薦。請閱讀使用條款以了解更多資訊。