OPEN-SOURCE SCRIPT
已更新 ADL Price Ratio
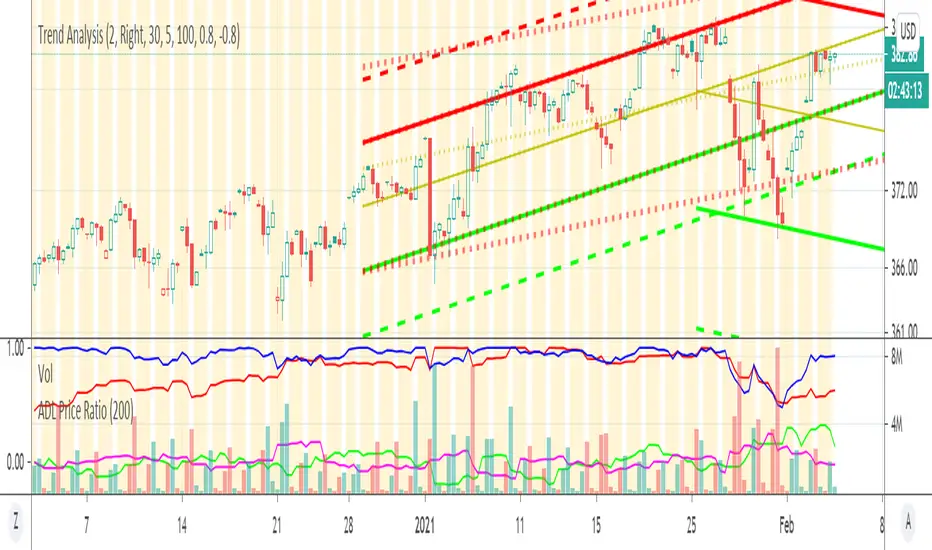
This script measures percentage of ADL movement relative and difference to Stock Price movement, in a core this measure reflects "how in-the-market (ADL) volume moves Stock Price".
The higher green line, the easier prices moves higher, the smaller black line (ADL - Price difference) the more price reflects volume movements (e.g. ADL up -> Stock Price up same amount)
The higher green line, the easier prices moves higher, the smaller black line (ADL - Price difference) the more price reflects volume movements (e.g. ADL up -> Stock Price up same amount)
發行說明
- Removed moving averages which were cluttering chart發行說明
Updated scenario when percent reaches 100% and thus difference with previous may be incorrect if ATH being hit continuously. As a result more accurate buyer/seller pressure on price is reflected (green vs magenta lines)On high level if green line (buyer AD moving price higher easily) higher than magenta (seller AD moving price down easily) and AD (red line) is going higher that means price moves higher on lower volume (ease of pressure to downward)
開源腳本
In true TradingView spirit, the creator of this script has made it open-source, so that traders can review and verify its functionality. Kudos to the author! While you can use it for free, remember that republishing the code is subject to our House Rules.
免責聲明
The information and publications are not meant to be, and do not constitute, financial, investment, trading, or other types of advice or recommendations supplied or endorsed by TradingView. Read more in the Terms of Use.