OPEN-SOURCE SCRIPT
Chart Mojo Neutral Unwound Cloud
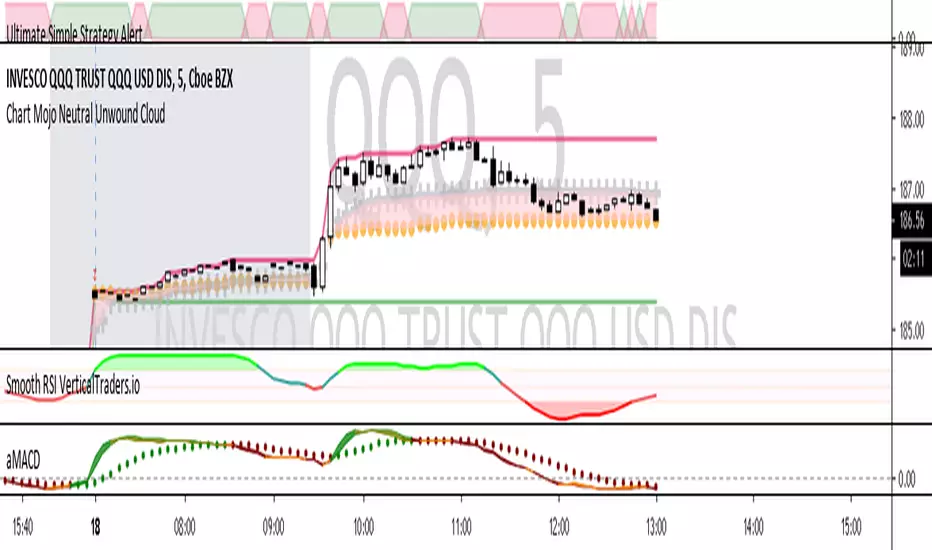
Plots days high/low and the Chart Mojo neutral cloud, the zone between vwap and 50% range. A secondary gravity right behind the opening 1 min range. The gray crosses are the vwap the gold dots are 50% of developing range. The shaded area between vwap and 50% range is the Chart Mojo cloud...I think of it as traders from the open tend to unwind to it many times a day. More returns on a trend day but you will see urges toward it on trend days. Price tends to urge to it ahead of 10:30 session "1" and 1:15 Session 2. If you get used to watching it and its relationship to price and the opening 1 min range you should start to see tendencies as to when price unwinds toward it.. etc. Where price is in relation to the cloud and the clouds relationship to the opening 1 min range can reveal real time bias. You will being to see, upon observation how traders target the vwap and 50% with target tier of buys and sells etc. Often unwinds to the zones gravity. It takes force or a catalyst to break the gravity. I use it in conjuction with Time Zone theory and Wave and Pattern force...and look to leading correlating hi beta movers and internals like tick and new streaming highs-new straming lows to get jump on what you see on a big etf or index etc. If you intraday tendencies the neutral is very helpful.
開源腳本
秉持TradingView一貫精神,這個腳本的創作者將其設為開源,以便交易者檢視並驗證其功能。向作者致敬!您可以免費使用此腳本,但請注意,重新發佈代碼需遵守我們的社群規範。
免責聲明
這些資訊和出版物並非旨在提供,也不構成TradingView提供或認可的任何形式的財務、投資、交易或其他類型的建議或推薦。請閱讀使用條款以了解更多資訊。
免責聲明
這些資訊和出版物並非旨在提供,也不構成TradingView提供或認可的任何形式的財務、投資、交易或其他類型的建議或推薦。請閱讀使用條款以了解更多資訊。