INVITE-ONLY SCRIPT
已更新 Force Index - Multi Timeframe [WYCKOFF ARSENAL]
WYCKOFF ARSENAL is now available on TradingView!
Based on <<The Wyckoff Method>> (Richard D. Wyckoff)
Noted Indicators:
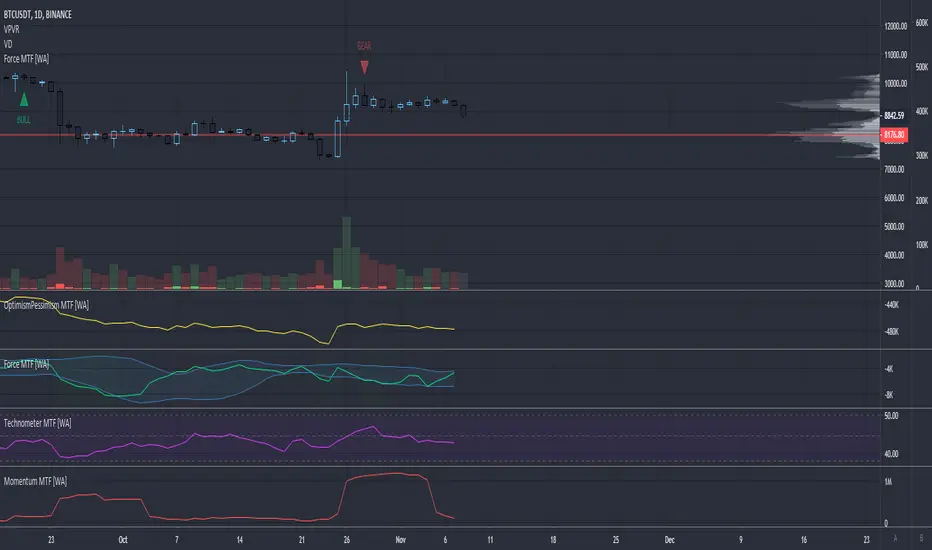
▪ Optimism Pessimism Index
▪ Force Index ◄
▪ Technometer
▪ Momentum
Main Features:
▪ Multi Timeframe is available
▪ Volume based indicators
▪ Can be used on pairs that have volume data
────────────────────────────
Highlights
> Optimism Pessimism Index or OP
The value of the OP is not important.
The action of the OP is important.
The action of the index must be compared to its previous action or to the price index over the same period of time.
> Technometer or TEC
The purpose of the Technometer is to provide a mathematical indication of the degree to which the market is overbought or oversold.
The value of the Technometer could be as high as 100 or as low as 0.
The other possible values would represent degrees of overbought or oversold.
How to read the Technometer:
| Overbought means vulnerable to a reaction |
100 - completely overbought market.
── 60 - actual overbought extreme.
──── 50 or higher is considered to be clearly over bought.
────── lower than 50 - relatively overbought.
──────── Everything in between clearly overbought and clearly oversold is neutral.
────────── A reading of 44.4 is absolute neutrality.
──────── Everything in between clearly overbought and clearly oversold is neutral.
────── higher than 38 - relatively oversold.
──── 38 or lower is considered to be clearly over sold.
── 28 - actual oversold extreme.
0 - completely oversold market.
| Oversold means vulnerable to a rally |
> Force
The purpose of the Force Index is to provide an indication of the pressure being applied to push the market lower or the pull being applied to the market to pull it higher.
> Momentum
The purpose of the Momentum is to provide a measure of the speculative interest in the market.
Based on <<The Wyckoff Method>> (Richard D. Wyckoff)
Noted Indicators:
▪ Optimism Pessimism Index
▪ Force Index ◄
▪ Technometer
▪ Momentum
Main Features:
▪ Multi Timeframe is available
▪ Volume based indicators
▪ Can be used on pairs that have volume data
────────────────────────────
Highlights
> Optimism Pessimism Index or OP
The value of the OP is not important.
The action of the OP is important.
The action of the index must be compared to its previous action or to the price index over the same period of time.
> Technometer or TEC
The purpose of the Technometer is to provide a mathematical indication of the degree to which the market is overbought or oversold.
The value of the Technometer could be as high as 100 or as low as 0.
The other possible values would represent degrees of overbought or oversold.
How to read the Technometer:
| Overbought means vulnerable to a reaction |
100 - completely overbought market.
── 60 - actual overbought extreme.
──── 50 or higher is considered to be clearly over bought.
────── lower than 50 - relatively overbought.
──────── Everything in between clearly overbought and clearly oversold is neutral.
────────── A reading of 44.4 is absolute neutrality.
──────── Everything in between clearly overbought and clearly oversold is neutral.
────── higher than 38 - relatively oversold.
──── 38 or lower is considered to be clearly over sold.
── 28 - actual oversold extreme.
0 - completely oversold market.
| Oversold means vulnerable to a rally |
> Force
The purpose of the Force Index is to provide an indication of the pressure being applied to push the market lower or the pull being applied to the market to pull it higher.
> Momentum
The purpose of the Momentum is to provide a measure of the speculative interest in the market.
發行說明
Bug fixes and improvements, added alert functionality (Divergences, Bollinger Bands)Rainbow version of this indicator is available on this page: 🌈 Rainbow Force
A Market Screener using this indicator is available on this page: Market Screener
僅限邀請腳本
僅作者批准的使用者才能訪問此腳本。您需要申請並獲得使用許可,通常需在付款後才能取得。更多詳情,請依照作者以下的指示操作,或直接聯絡KryptoNight。
TradingView不建議在未完全信任作者並了解其運作方式的情況下購買或使用腳本。您也可以在我們的社群腳本中找到免費的開源替代方案。
作者的說明
Join the Discord Server for more info about the published tools.
discord.io/CryptoWorld
a Discord bot for Charting (TradingView and Heatmaps) is available
🟣 If you like any of my Invite-Only Tools, let me know
(DM or Discord for inquiries)
discord.io/CryptoWorld
a Discord bot for Charting (TradingView and Heatmaps) is available
🟣 If you like any of my Invite-Only Tools, let me know
(DM or Discord for inquiries)
免責聲明
這些資訊和出版物並非旨在提供,也不構成TradingView提供或認可的任何形式的財務、投資、交易或其他類型的建議或推薦。請閱讀使用條款以了解更多資訊。