SimpleTradingTechniques

ENGULFING CANDLESTICK STRATEGY

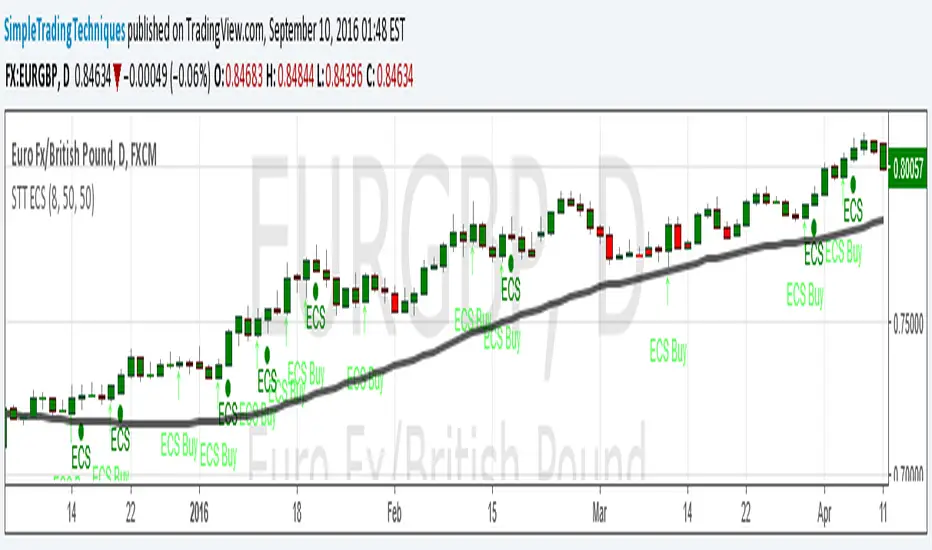
(i) Arrow represent trade setup

(ii) Circle represent triggering of the trade
--------------------------------------------------------------------
1. Where to place stop loss?
2. Where to exit the trade?
3. How to protect gains in your trade?
4. How to apply money management rule?
5. How to trade gap opening?

開源腳本

本著真正的TradingView精神,該腳本的作者將其開源發布,以便交易者可以理解和驗證它。為作者喝彩吧!您可以免費使用它,但在出版物中重複使用此代碼受網站規則的約束。 您可以收藏它以在圖表上使用。

免責聲明

這些資訊和出版物並不意味著也不構成TradingView提供或認可的金融、投資、交易或其他類型的意見或建議。請在使用條款閱讀更多資訊。

想在圖表上使用此腳本?
//  By SIMPLE TRADING TECHNIQUES

//   	Arrow represent trade setup 
//   	Circle represent triggering of the trade
//--------------------------------------------------------------------

study(title="STT ENGULFING CANDLESTICK STRATEGY",overlay = true, shorttitle="STT ECS")
src = close, len = input(8, minval=1, title="Length")
up = rma(max(change(src), 0), len)
down = rma(-min(change(src), 0), len)
rsi = down == 0 ? 100 : up == 0 ? 0 : 100 - (100 / (1 + up / down))

//coloring method below

src1 = close, len1 = input(50, minval=1, title="UpLevel")
src2 = close, len2 = input(50, minval=1, title="DownLevel")
isup() => rsi > len1
isdown() => rsi < len2
barcolor(isup() ? green : isdown() ? red : na )

//study('buy/sell arrows', overlay=true)

out = sma(close, 50)
data = rsi > len1 ? open[1] > close[1] ? close > open ? close >= open[1] ? close[1] >= open ? close - open > open[1] - close[1] ? high > out : na : na : na : na : na : na
data1 = rsi < len2 ? close[1] > open[1] ? open > close ? open >= close[1] ? open[1] >= close ? open - close > close[1] - open[1] ? low < out : na : na : na : na : na : na


plotchar(data, char='↑',location=location.belowbar, color=lime, text="ECS Buy")
plotchar(data1, char='↓', location=location.abovebar, color=red, text="ECS Sell")

//Trade Trigger
tiggerlongcandle = (data[1] == 1) and (high > high[1]) ? 1 : 0
tiggershortcandle = (data1[1] == 1) and (low < low[1]) ? 1 : 0
plotshape(tiggerlongcandle ? tiggerlongcandle : na, title="Triggered Long",style=shape.circle, location=location.belowbar, color=green, transp=0, offset=0, text="ECS")
plotshape(tiggershortcandle ? tiggershortcandle : na, title="Triggered Short",style=shape.circle, location=location.abovebar, color=red, transp=0, offset=0, text="ECS")

plot (out, color = black, linewidth = 3, title = "Trend - Long Term")