INVITE-ONLY SCRIPT
已更新 Critical Support & Resistance Level (supply & demand zone)
Support & Resistance Level and Supply & Demand Zone are very common and popular jargon in technical analysis.
What is the difference between Support & Resistance Level and Supply & Demand Zone?
In my opinion, Support & Resistance Level is the value of price that tested couple times and hard to break. The zone is formed by two adjacent levels where price may oscillate between those two levels.
Imagine the levels as horizontal lines, and the zones are areas between two horizontal lines.
Why are they important?
In a nutshell, they indicate where the price direction may reverse so you can act accordingly.
There are a couple methods to draw the Support & Resistance Level and Supply & Demand Zone, In most case, people will use swing high or low, or pivot points as the level. But there are too many of them, and not all pivot points will become Support & Resistance Level.
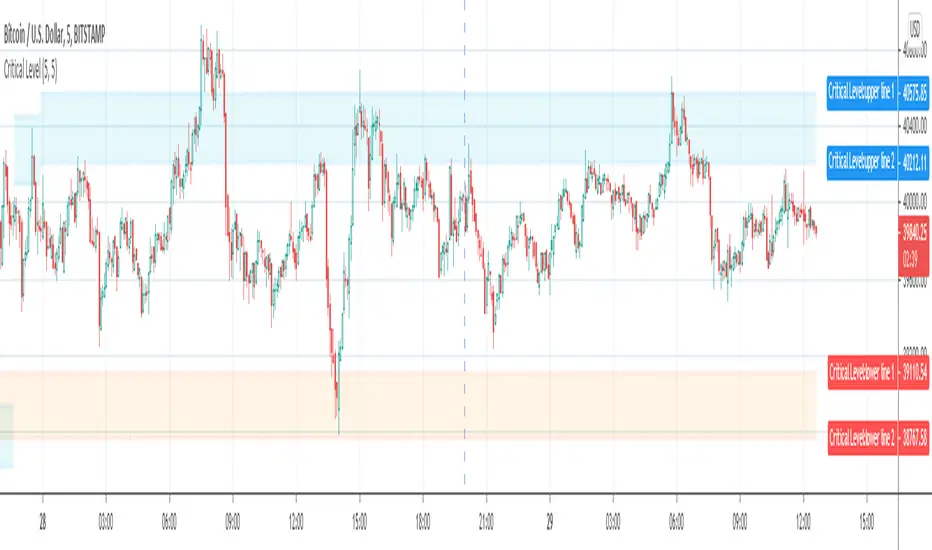
Some of the support or resistance level is hard to break, but after the price break through that level, resistance will become support and vice versa, I define it as Critical Level.
If you draw a critical support or resistance level from the current bar and move backward to where it started, you will notice that some levels are formed by the pivot points from hundreds of bars ago. It's impossible to discover the Critical Levels if you don't have enough bars loaded on chart.
The purpose of this indicator is to plot critical support and resistance level automatically on chart.
It will work on all market, Stock, Forex and Futures. It also works on all timeframes.
Inputs:
The Strength inputs control the intensity of Support & Resistance Level.
The Alert input is the switch of alert function.
By enable Enhanced mode, the indicator will be more critical.
Check Showline input to plot level lines on chart, otherwise, it will plot zones only.
What is the difference between Support & Resistance Level and Supply & Demand Zone?
In my opinion, Support & Resistance Level is the value of price that tested couple times and hard to break. The zone is formed by two adjacent levels where price may oscillate between those two levels.
Imagine the levels as horizontal lines, and the zones are areas between two horizontal lines.
Why are they important?
In a nutshell, they indicate where the price direction may reverse so you can act accordingly.
There are a couple methods to draw the Support & Resistance Level and Supply & Demand Zone, In most case, people will use swing high or low, or pivot points as the level. But there are too many of them, and not all pivot points will become Support & Resistance Level.
Some of the support or resistance level is hard to break, but after the price break through that level, resistance will become support and vice versa, I define it as Critical Level.
If you draw a critical support or resistance level from the current bar and move backward to where it started, you will notice that some levels are formed by the pivot points from hundreds of bars ago. It's impossible to discover the Critical Levels if you don't have enough bars loaded on chart.
The purpose of this indicator is to plot critical support and resistance level automatically on chart.
It will work on all market, Stock, Forex and Futures. It also works on all timeframes.
Inputs:
The Strength inputs control the intensity of Support & Resistance Level.
The Alert input is the switch of alert function.
By enable Enhanced mode, the indicator will be more critical.
Check Showline input to plot level lines on chart, otherwise, it will plot zones only.
發行說明
Added 4 new alert types發行說明
Minor update.發行說明
Update to version 4 with a new algorithm to automatically check uptrend and downtrend Support & Resistance Levels.發行說明
Update to version=5僅限邀請腳本
只有經作者批准的使用者才能訪問此腳本。您需要申請並獲得使用權限。該權限通常在付款後授予。如欲了解更多詳情,請依照以下作者的說明操作,或直接聯絡Patternsmart。
除非您完全信任其作者並了解腳本的工作原理,否則TradingView不建議您付費或使用腳本。您也可以在我們的社群腳本中找到免費的開源替代方案。
作者的說明
Use the link below to obtain access to this indicator, https://www.patternsmart.com/cart/index.php?route=product/product&product_id=380&search=critical
免責聲明
這些資訊和出版物並不意味著也不構成TradingView提供或認可的金融、投資、交易或其他類型的意見或建議。請在使用條款閱讀更多資訊。
僅限邀請腳本
只有經作者批准的使用者才能訪問此腳本。您需要申請並獲得使用權限。該權限通常在付款後授予。如欲了解更多詳情,請依照以下作者的說明操作,或直接聯絡Patternsmart。
除非您完全信任其作者並了解腳本的工作原理,否則TradingView不建議您付費或使用腳本。您也可以在我們的社群腳本中找到免費的開源替代方案。
作者的說明
Use the link below to obtain access to this indicator, https://www.patternsmart.com/cart/index.php?route=product/product&product_id=380&search=critical
免責聲明
這些資訊和出版物並不意味著也不構成TradingView提供或認可的金融、投資、交易或其他類型的意見或建議。請在使用條款閱讀更多資訊。