PROTECTED SOURCE SCRIPT
TradersHunt Buy & Sell Levels Indicator

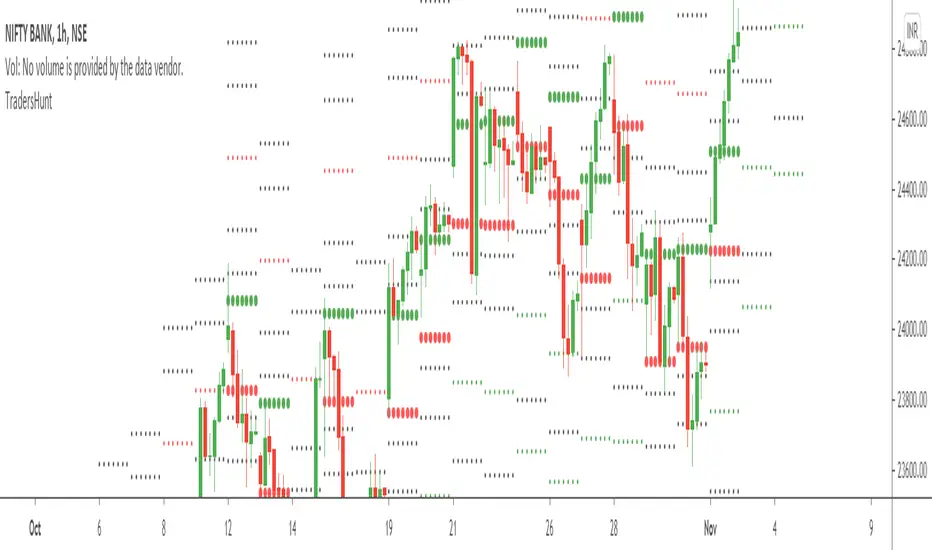
This indicator will plot dot lines that represent the support and resistance points or a key price where favourable action may take place.
This indicator is based on the concept of Fibonacci ratios. The dotted line represents different Fibonacci ratios of the script. The calculation for the ratios is arrived by considering a range based on the volatility of the script.
You may think it's another Pivot Point or Camarilla type level indicator, no, it is not, it is different.
It follows the Fibonacci ratio which makes it unique amongst all the available indicators.
How to Trade:
It can be used by traders to identify possible areas of support and resistance, which can then be used to determine optimal positions for stop-loss or profit target orders.
Green Level indicates buy price, a trader should wait for 15min candle to close above it and Red level can be used as SL if the trader is taking a long position. The Black colored levels above Green are Targets for taken Long Position. Similarly, a red-colored level indicates Sell value, and levels below it are targets for a short position.
It's not just the breakout indicator, but also a reversal indicator. which means if you are a safe trader you can wait for the breakout above the green line or breakdown below the red line.
However, if you are familiar with little technical analysis then you can treat the red dotted line as the buy zone and the green dotted zone as the sell zone based on the trend of the script.
You can keep trailing you Stop Loss once script moves into your direction. First step to do is to make our SL Cost to Cost and when it moves above TGT2, we can trail SL to TGT1 and so on. So, Keep your money management in check.
Fibonacci are earlier market turning points. Hence, they are natural choices for projecting support and resistance levels. Every fibo ratio is a potential support or resistance level. However, for effective trading, focus on major ratios which are highlighted with bold dotted lines.
受保護腳本
此腳本以閉源形式發佈。 不過,您可以自由使用,沒有任何限制 — 點擊此處了解更多。
免責聲明
這些資訊和出版物並非旨在提供,也不構成TradingView提供或認可的任何形式的財務、投資、交易或其他類型的建議或推薦。請閱讀使用條款以了解更多資訊。
受保護腳本
此腳本以閉源形式發佈。 不過,您可以自由使用,沒有任何限制 — 點擊此處了解更多。
免責聲明
這些資訊和出版物並非旨在提供,也不構成TradingView提供或認可的任何形式的財務、投資、交易或其他類型的建議或推薦。請閱讀使用條款以了解更多資訊。