OPEN-SOURCE SCRIPT
OHLC Percent Extension
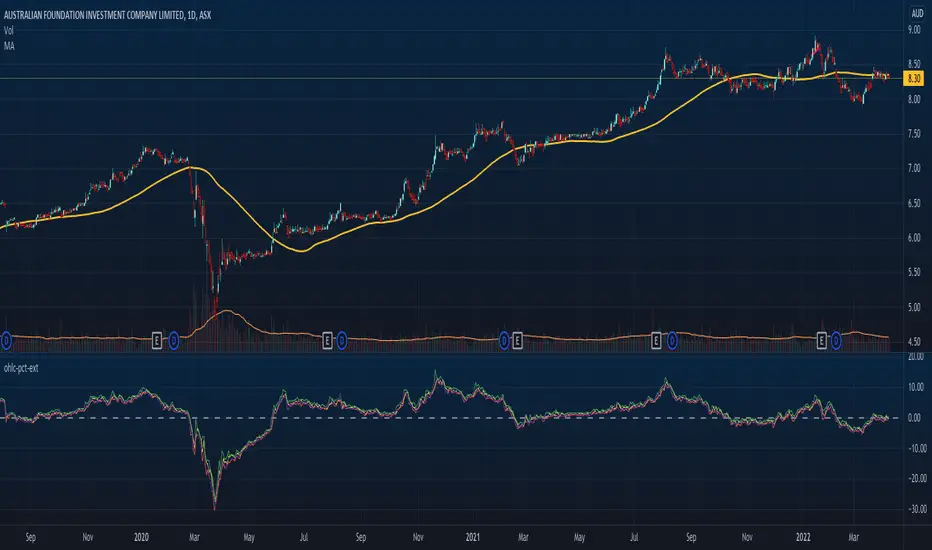
This indicator visually shows OHLC moves in terms of percentages compared to an input reference series, e.g. this could be a moving average line, and then plotting how far OHLC values are from that reference at each time unit/bar.
A centre/zero-line is shown to indicate little to no extension when prices are hovering about there. This could a profit taking point, or an entry point, depending on the system at play.
You may also only be interested in Highs and Lows extension, for example, in which case simply hide the other lines from the indicator settings.
It may factor into trading systems considering both mean reversions, or trend breakouts/breakdowns.
開源腳本
In true TradingView spirit, the creator of this script has made it open-source, so that traders can review and verify its functionality. Kudos to the author! While you can use it for free, remember that republishing the code is subject to our House Rules.
免責聲明
The information and publications are not meant to be, and do not constitute, financial, investment, trading, or other types of advice or recommendations supplied or endorsed by TradingView. Read more in the Terms of Use.