OPEN-SOURCE SCRIPT
Adjacent HMA Stop
Release Note:
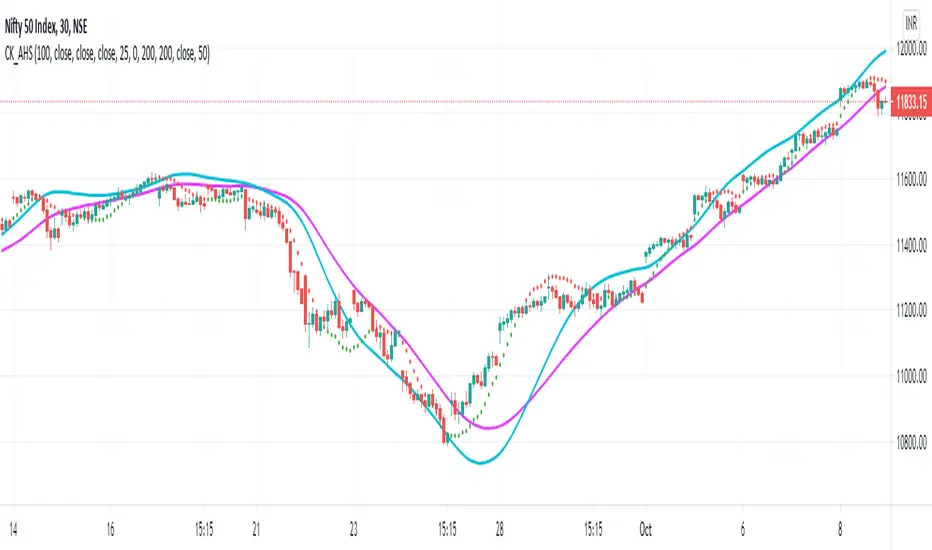
This indicator script setup is published to identify the strength and ride the trends.
HMA:
HMA 100 period is used as default. However this can be changed as per wish. Major turning points or decisions can be made using this HMA line. Purple color is used to identify this. This can be used as the final extreme stop for any trend before it turns.
Adjacent Line:
Blue colored Adjacent line can be used to determine the trend strength or ride the trend till it slows down. When trending move happens it can be ride till the candles comes within this Adjacent line. And then sideways move or the moves between HMA & Adjacent line can be traded
Stop:
Dotted lines in Red and Green colors are used as very tight stop. This can be also used as first level of profit booking when very strong move happens.
Trend View:
There is an optional 'Trend View' which can be used to determined the trend.
Disclaimer:
//This script/indicator published with the idea of finding the strength of any instruments. Trade decisions and execution are up to the traders/users as per their understanding
//Courtesy: Thanks to Alan Hull and Richard Donchian as some of the concepts are inspired from them
開源腳本
本著TradingView的真正精神,此腳本的創建者將其開源,以便交易者可以查看和驗證其功能。向作者致敬!雖然您可以免費使用它,但請記住,重新發佈程式碼必須遵守我們的網站規則。
免責聲明
這些資訊和出版物並不意味著也不構成TradingView提供或認可的金融、投資、交易或其他類型的意見或建議。請在使用條款閱讀更多資訊。
免責聲明
這些資訊和出版物並不意味著也不構成TradingView提供或認可的金融、投資、交易或其他類型的意見或建議。請在使用條款閱讀更多資訊。