OPEN-SOURCE SCRIPT
已更新 Flat Numbers
Customizable Price Range: Set the start price and end price to define the range in which horizontal lines will be plotted.
Line Color: Choose the color of the horizontal lines to match your chart's theme or personal preference.
Line Width: Adjust the width of the lines (from 1 to 5) to control their visibility.
Price Step Size: By default, the script plots lines every 100 price units within the range, but this step size can be customized if desired.
Dynamic Line Plotting: The script automatically calculates the number of lines needed and plots them at each interval between the start and end prices.
發行說明
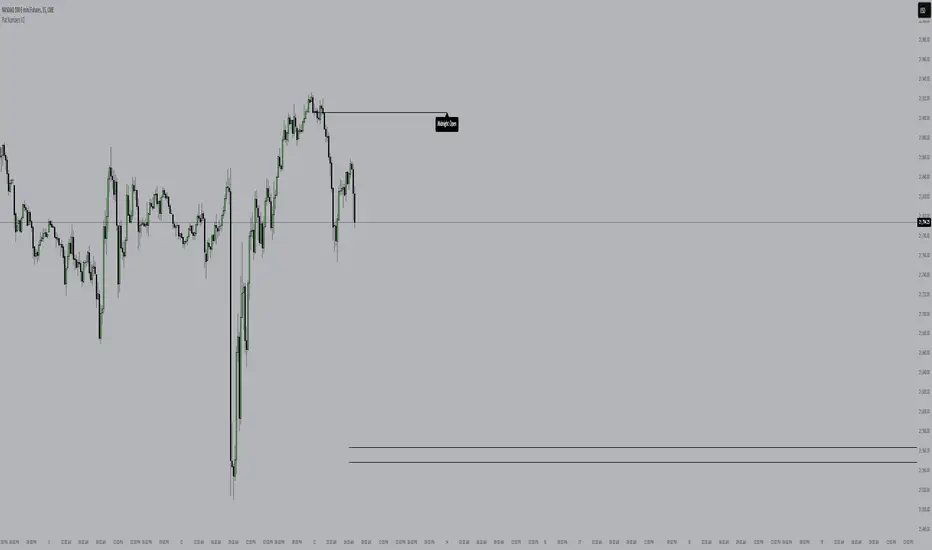
This script draws two lines on a chart:1. **Price Range Lines**: It lets you define a start and end price, then draws horizontal lines at every 100 price units in between.
2. **Opening Lines**: It draws two lines:
- One for the **Midnight Open** (00:00 NY time)
- One for the **08:30 Open** (NY time)
You can customize the color, style, and width of these lines, and optionally add labels showing "Midnight Open" or "08:30 Open". You can also choose the timezone.
In short: It helps visualize key price levels (range) and opening times with customizable lines and labels.
發行說明
added 830am range 開源腳本
秉持TradingView一貫精神,這個腳本的創作者將其設為開源,以便交易者檢視並驗證其功能。向作者致敬!您可以免費使用此腳本,但請注意,重新發佈代碼需遵守我們的社群規範。
免責聲明
這些資訊和出版物並非旨在提供,也不構成TradingView提供或認可的任何形式的財務、投資、交易或其他類型的建議或推薦。請閱讀使用條款以了解更多資訊。
開源腳本
秉持TradingView一貫精神,這個腳本的創作者將其設為開源,以便交易者檢視並驗證其功能。向作者致敬!您可以免費使用此腳本,但請注意,重新發佈代碼需遵守我們的社群規範。
免責聲明
這些資訊和出版物並非旨在提供,也不構成TradingView提供或認可的任何形式的財務、投資、交易或其他類型的建議或推薦。請閱讀使用條款以了解更多資訊。