INVITE-ONLY SCRIPT
已更新 MOMEMTUM READER ULTIMATE
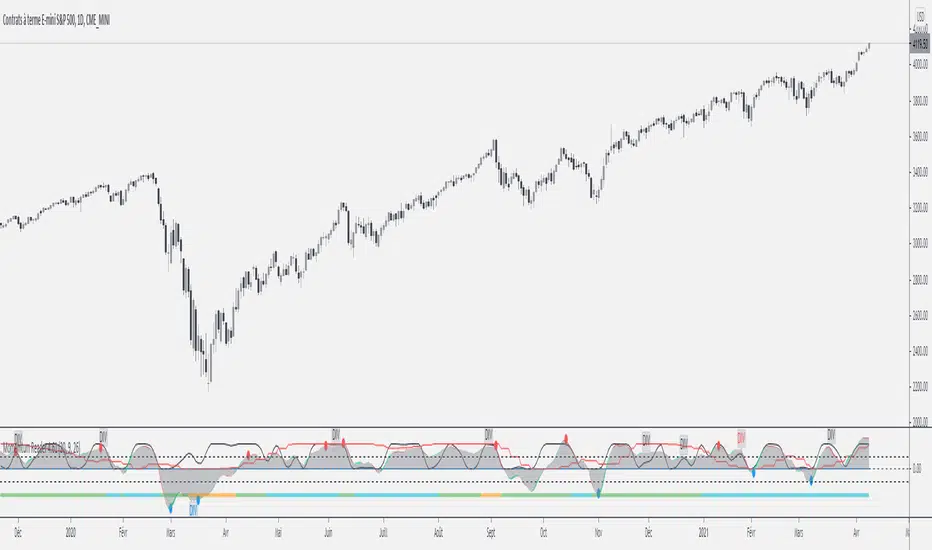
Momemtum Reader is the complement of Market Reader it will help you to find market Top and Bottom.
發行說明
V2 with better pattern發行說明
Huge improvement發行說明
bug correction發行說明
update of overbought and sold pattern發行說明
Improvement of overbought and sell pattern發行說明
Update v3:-Add Fast and slow momemtum
-Add RSI divergence highlight (black triangle)
-Add RSI overlay
-Add oversold/buy pattern (blue/red dots)
發行說明
bug fix for Multi-time Frame Momemtum發行說明
Improvement of:-Oversold/Bougth pattern
-Divergence
-Trend exhaustion detection
發行說明
Bug alert fixed發行說明
Update:1) add custom Period
2)Add older Momemtum (in option)
發行說明
Adding stochastic plot as option發行說明
Update to 4.1 version:-Improvement of the code
-Adding Bear (red circle) and Bull ( blue circle) signal for aggressive entry
-Adding alarm for each pattern
發行說明
-Add option to use fastest momemtum to improve divergence/convergence trading發行說明
//Version 4.5//*smoothing improved
* Div pattern plot on the momemtum
發行說明
Version 4.6:*Red and blue circle mean Overbougth and oversold
*Divergence pattern are plot in Black for Momemtum divergence only, and in RED if in addition to momemtum divergence there is a RSI divergence with RSI>70 or <30
* In bull trend:
- Blue circle mean BUY the Pullback
- Bull divergence mean BUY the Pullback
- Red circle or black bear divergence mean Partial take profit (according to your TA)
- Red divergence mean possible reversal (according to your TA)
It is the opposite for Bear Trend
發行說明
// VERSIOn 4.61:-Add option to plot previous top and bottom pattern (default parameter is false)
Apprendre la méthode:
discord.gg/b7YGtY2
Site internet: marketreader.fr/
Chaine Youtube : youtube.com/channel/UC-a7p8DkfbDM6ONrTzsaErA?view_as=subscriber
discord.gg/b7YGtY2
Site internet: marketreader.fr/
Chaine Youtube : youtube.com/channel/UC-a7p8DkfbDM6ONrTzsaErA?view_as=subscriber
免責聲明
這些資訊和出版物並不意味著也不構成TradingView提供或認可的金融、投資、交易或其他類型的意見或建議。請在使用條款閱讀更多資訊。