OPEN-SOURCE SCRIPT
NR7 Indicator Based on Thomas Bulkowski's Theories
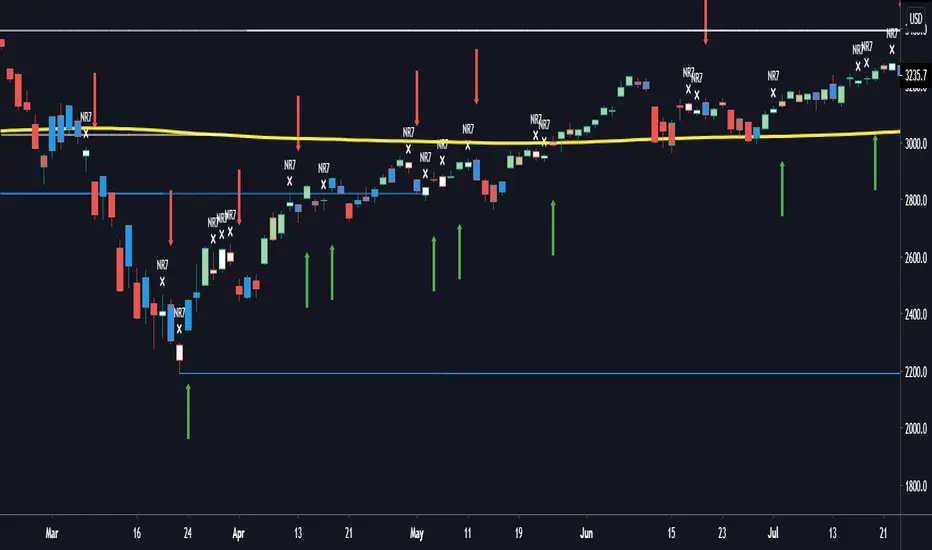
This NR7 indicator was built on the concept by Thomas Bulkowski and his ThePatternSite. NR7 is based on high to low price range (true range) that is the smallest of the prior 6 days (7 days total), when one NR7 shows, it means that today's candle body (low to high) is the narrowest of the past 7 days. Then if the current close is higher than the NR7's high, we call it a bullish breakout; and if the current close is lower than the NR7's low, we call it a bearish breakout. Regardless the direction, once the current close price goes above or below the high or low of the NR7 candle, we call it a "breakout" in this strategy. Bulkowski suggested on his website that only gave 7 calendar days (NOT trading days) for the symbol to breakout after NR7 occurs, and if the underlying asset does not breakout within 7 calendar days after one NR7 occurs, we would abandon this NR7 signal and start recounting again.
Since most securities/indexes do not trade on the weekends and have no data available, I switched 7 calendar days breakout limit to 5 trading days breakout limit, which will work on most assets. However, if you are trading cryptocurrencies or forex which have data on the weekends, feel free to add 2 more days to finish the NR7 count, all you have to do is to add "Buy6", "Buy7", "Sell6" and "Sell7" under line 11 and line 17, then add the senarioes under those "if" statements.
Every "NR7" will show up on the chart with a cross symbol and text next to it, then green arrowups show bullish signals and red arrowdowns show bearish signals. Bulkowski also added a "CPI" index on his NR7 strategy, this indicator does not include that "CPI equation" for simplicity purposes and other time frame tradings other than just weekly signals. Please like and share this script, let me know if any questions, thanks!
開源腳本
秉持TradingView一貫精神,這個腳本的創作者將其設為開源,以便交易者檢視並驗證其功能。向作者致敬!您可以免費使用此腳本,但請注意,重新發佈代碼需遵守我們的社群規範。
免責聲明
這些資訊和出版物並非旨在提供,也不構成TradingView提供或認可的任何形式的財務、投資、交易或其他類型的建議或推薦。請閱讀使用條款以了解更多資訊。
開源腳本
秉持TradingView一貫精神,這個腳本的創作者將其設為開源,以便交易者檢視並驗證其功能。向作者致敬!您可以免費使用此腳本,但請注意,重新發佈代碼需遵守我們的社群規範。
免責聲明
這些資訊和出版物並非旨在提供,也不構成TradingView提供或認可的任何形式的財務、投資、交易或其他類型的建議或推薦。請閱讀使用條款以了解更多資訊。