INVITE-ONLY SCRIPT
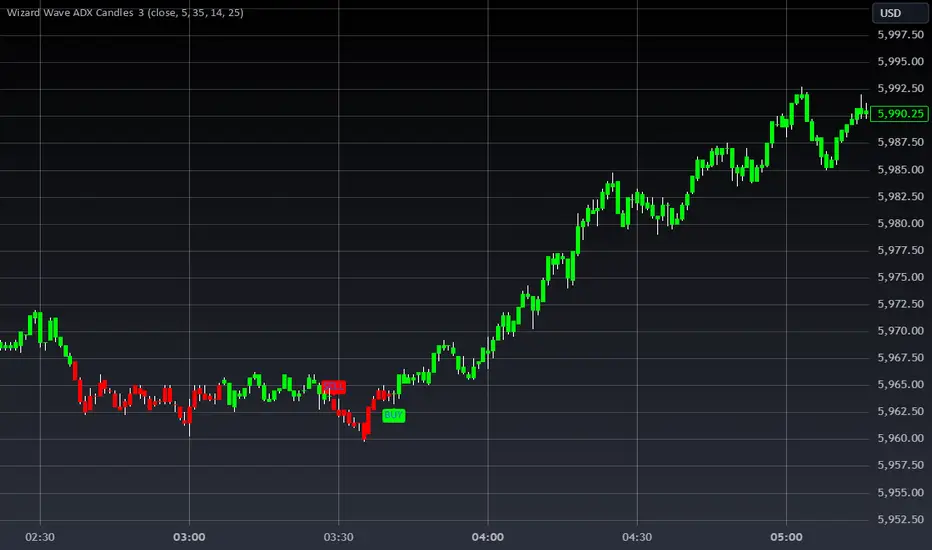
Wizard Wave ADX 3 Candles
Indicator Overview
Use with Wizard Wave ADX 3 for better results
Purpose: Combines moving average differences (SMADif) with the ADX (Average Directional Index) to generate buy and sell signals.
Features:
Displays a histogram based on the difference between two SMAs (short and long).
Colors the histogram and bars green or red based on trend direction.
Generates buy and sell signals when certain conditions are met.
Inputs and Configuration
Source (src): The price data used for calculations (default: close).
SMA1 Length (sma1length): Short SMA period (default: 5).
SMA2 Length (sma2length): Long SMA period (default: 35).
Show Dif as Percent (UsePercent): Whether the SMA difference is shown as a percentage of the current candle's close.
ADX Length (adxLength): Period for calculating the ADX (default: 14).
ADX Threshold (adxThreshold): Minimum ADX value to trigger buy/sell signals (default: 25).
How It Works
Moving Average Difference (SMADif):
Calculates the difference between two SMAs.
Optionally normalizes it as a percentage of the current price.
ADX Calculation:
Measures trend strength using the ADX formula.
Signal Logic:
Buy Signal: SMADif crosses above 0, is positive (green), and ADX is above the threshold.
Sell Signal: SMADif crosses below 0, is negative (red), and ADX is above the threshold.. Visual Outputs
Histogram:
A histogram of SMADif is plotted with green for positive values and red for negative values.
Bar Colors:
Bars are colored green for upward trends and red for downward trends.
Buy and Sell Signals:
"BUY" labels are shown below bars when buy conditions are met.
"SELL" labels are shown above bars when sell conditions are met.
Adjust the SMA lengths, ADX length, or threshold values in the script’s settings to match your trading strategy.
Interpret Signals:
Look for the green "BUY" and red "SELL" labels on the chart.
Use the histogram Wizard Wave ADX 3 and bar colors to confirm trends and potential entry/exit points.
Practical Use
Trend Following:
Use the indicator in trending markets where ADX confirms strong trend strength.
Choppy Markets: May generate false signals during sideways or low-volatility markets.
Parameter Sensitivity: Requires tuning of SMA lengths and ADX thresholds to align with specific trading instruments.
This indicator can serve as a helpful guide for trend-following strategies, especially when paired with additional analysis and risk management.
"Disclaimer: This indicator is intended for educational purposes only and does not constitute financial advice. Trading involves significant risk, and users should perform their own research and consult with a licensed financial advisor before making any trading decisions."
僅限邀請腳本
僅作者批准的使用者才能訪問此腳本。您需要申請並獲得使用許可,通常需在付款後才能取得。更多詳情,請依照作者以下的指示操作,或直接聯絡WIZARDTRENDS。
請注意,此私人、僅限受邀使用者使用的腳本未經腳本審核員審核,其是否符合社群規範尚待確定。 TradingView不建議在未完全信任作者並了解其運作方式的情況下購買或使用腳本。您也可以在我們的社群腳本中找到免費的開源替代方案。
作者的說明
FEEL FREE TO REACH US
免責聲明
這些資訊和出版物並非旨在提供,也不構成TradingView提供或認可的任何形式的財務、投資、交易或其他類型的建議或推薦。請閱讀使用條款以了解更多資訊。