PROTECTED SOURCE SCRIPT
target price with DCF method by N' TEEREX Hoonjongpang
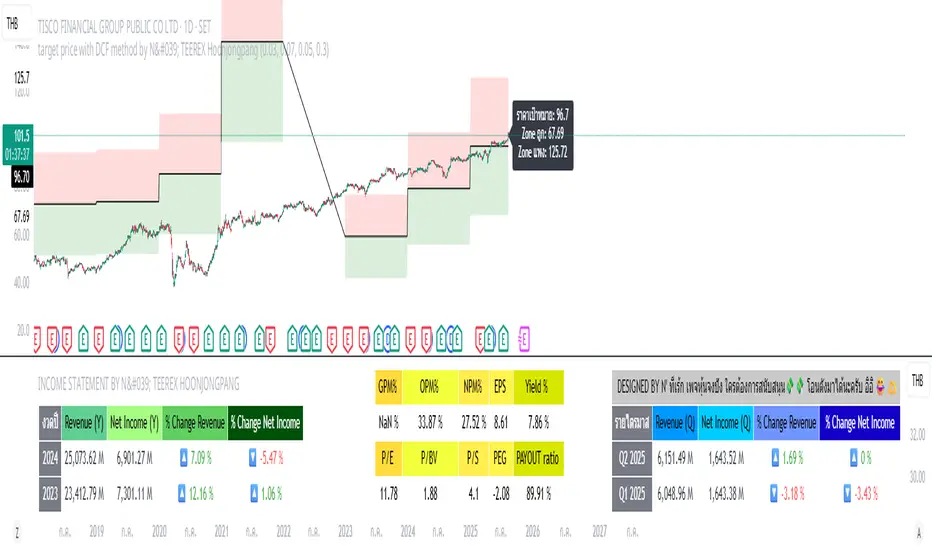
This indicator calculates a stock’s intrinsic value using the latest fiscal year data: free cash flow, debt, equity, shares outstanding, and taxes.
It computes the Weighted Average Cost of Capital (WACC), applies the Gordon Growth formula, and derives a price per share.
A margin of safety is applied to define zones on the chart:
Green Zone: Safe (undervalued)
Red Zone: Not Safe (overvalued)
All key numbers, including WACC, price target, and zones, are displayed as a label.
Result: A visual and numeric guide to the stock’s fair value, helping investors quickly see if the current price is above or below estimated intrinsic value.
受保護腳本
此腳本以閉源形式發佈。 不過,您可以自由使用,沒有任何限制 — 點擊此處了解更多。
免責聲明
這些資訊和出版物並非旨在提供,也不構成TradingView提供或認可的任何形式的財務、投資、交易或其他類型的建議或推薦。請閱讀使用條款以了解更多資訊。
受保護腳本
此腳本以閉源形式發佈。 不過,您可以自由使用,沒有任何限制 — 點擊此處了解更多。
免責聲明
這些資訊和出版物並非旨在提供,也不構成TradingView提供或認可的任何形式的財務、投資、交易或其他類型的建議或推薦。請閱讀使用條款以了解更多資訊。