PROTECTED SOURCE SCRIPT
TrendPilot AI v2 — Smart ATR Indicator with Zones
TrendPilot AI v2 is a smart price-action and ATR-based trading system designed for swing and position traders. It combines trend-following logic with adaptive price zones to help users identify high-probability Buy and Sell opportunities — along with intelligent re-entry points, weak signal detection, and visual structure zones.
🔧 Core Features:
✅ ATR-based Buy/Sell signals with confirmation logic
✅ Dynamic 99 EMA Channel for trend context
✅ Re-entry triangles for stacking or retracing setups
✅ 150 EMA Weak Signal Detection for early trend warnings
✅ 🧭 Price Action Zones (Premium, Equilibrium, Discount)
✅ Visual alerts via triangles, labels, and color-coded logic
✅ Designed for 15m, 1H, and 4H charts — also useful on Daily
🧠 How It Works (Logic Breakdown)
1️⃣ Trend Direction — EMA Channel Logic
A 99 EMA Channel determines the dominant market bias.
If price is above the channel → trend is Bullish → Buy signals are valid
If price is below the channel → trend is Bearish → Sell signals are valid
2️⃣ Buy/Sell Signals — ATR Trailing Logic
The system uses custom ATR trailing logic to detect when price momentum shifts.
When a breakout aligns with trend direction, a Buy or Sell label appears.
These are designed to capture the main trend leg or reversal zone.
3️⃣ Re-Entry Signals — Triangle Visual Cues
During a confirmed trend, if price retraces to the EMA channel, a small triangle is shown:
🔼 Green triangle: Buy re-entry during bullish trend
🔽 Red triangle: Sell re-entry during bearish trend
These are not new signals but continuation cues for advanced traders.
4️⃣ Weak Signal Detection — 150 EMA Logic
A secondary 150 EMA helps detect possible trend exhaustion.
If price dips below 150 EMA during a bullish run, an orange triangle appears (⚠️ caution).
If price rises above 150 EMA during a bearish run, a blue triangle appears.
This signals potential weakening of the active trend.
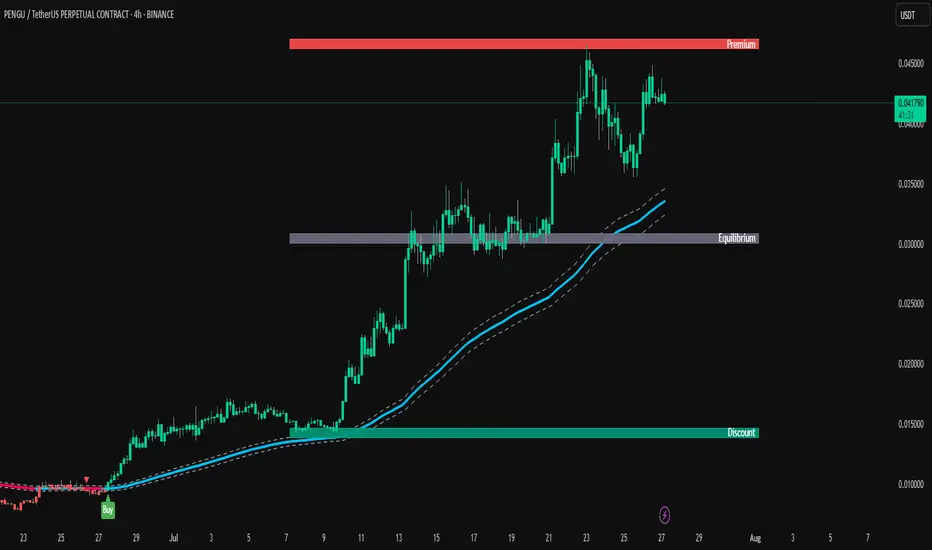
5️⃣ Price Zones — Premium, Equilibrium, Discount
TrendPilot AI v2 draws 3 smart price zones based on ATR & market structure:
🟥 Premium Zone (Top) → Overbought area, caution for long trades
🟨 Equilibrium Zone (Middle) → Fair value, consolidation possible
🟩 Discount Zone (Bottom) → Oversold, better long entries
These zones help filter signals and avoid entries in risky areas.
Example: Avoid Buy signals inside Premium zone.
🧪 Suggested Use:
⚠️ Note for Users:
This script is not repainting. All signals are plotted with stable logic.
Past performance does not guarantee future results — always backtest first.
Script does not contain financial advice — use at your own discretion.
🔧 Core Features:
✅ ATR-based Buy/Sell signals with confirmation logic
✅ Dynamic 99 EMA Channel for trend context
✅ Re-entry triangles for stacking or retracing setups
✅ 150 EMA Weak Signal Detection for early trend warnings
✅ 🧭 Price Action Zones (Premium, Equilibrium, Discount)
✅ Visual alerts via triangles, labels, and color-coded logic
✅ Designed for 15m, 1H, and 4H charts — also useful on Daily
🧠 How It Works (Logic Breakdown)
1️⃣ Trend Direction — EMA Channel Logic
A 99 EMA Channel determines the dominant market bias.
If price is above the channel → trend is Bullish → Buy signals are valid
If price is below the channel → trend is Bearish → Sell signals are valid
2️⃣ Buy/Sell Signals — ATR Trailing Logic
The system uses custom ATR trailing logic to detect when price momentum shifts.
When a breakout aligns with trend direction, a Buy or Sell label appears.
These are designed to capture the main trend leg or reversal zone.
3️⃣ Re-Entry Signals — Triangle Visual Cues
During a confirmed trend, if price retraces to the EMA channel, a small triangle is shown:
🔼 Green triangle: Buy re-entry during bullish trend
🔽 Red triangle: Sell re-entry during bearish trend
These are not new signals but continuation cues for advanced traders.
4️⃣ Weak Signal Detection — 150 EMA Logic
A secondary 150 EMA helps detect possible trend exhaustion.
If price dips below 150 EMA during a bullish run, an orange triangle appears (⚠️ caution).
If price rises above 150 EMA during a bearish run, a blue triangle appears.
This signals potential weakening of the active trend.
5️⃣ Price Zones — Premium, Equilibrium, Discount
TrendPilot AI v2 draws 3 smart price zones based on ATR & market structure:
🟥 Premium Zone (Top) → Overbought area, caution for long trades
🟨 Equilibrium Zone (Middle) → Fair value, consolidation possible
🟩 Discount Zone (Bottom) → Oversold, better long entries
These zones help filter signals and avoid entries in risky areas.
Example: Avoid Buy signals inside Premium zone.
🧪 Suggested Use:
✅ Timeframes: 15m / 1H / 4H / 1D
✅ Combine signals with zone analysis for optimal entries
✅ Use re-entry triangles to add or confirm during pullbacks
✅ Use weak signal warnings to tighten stops or manage risk
✅ Works best in trending environments or breakout markets
⚠️ Note for Users:
This script is not repainting. All signals are plotted with stable logic.
Past performance does not guarantee future results — always backtest first.
Script does not contain financial advice — use at your own discretion.
受保護腳本
此腳本以閉源形式發佈。 不過,您可以自由使用,沒有任何限制 — 點擊此處了解更多。
免責聲明
這些資訊和出版物並非旨在提供,也不構成TradingView提供或認可的任何形式的財務、投資、交易或其他類型的建議或推薦。請閱讀使用條款以了解更多資訊。
受保護腳本
此腳本以閉源形式發佈。 不過,您可以自由使用,沒有任何限制 — 點擊此處了解更多。
免責聲明
這些資訊和出版物並非旨在提供,也不構成TradingView提供或認可的任何形式的財務、投資、交易或其他類型的建議或推薦。請閱讀使用條款以了解更多資訊。