OPEN-SOURCE SCRIPT
Average Pip Movement
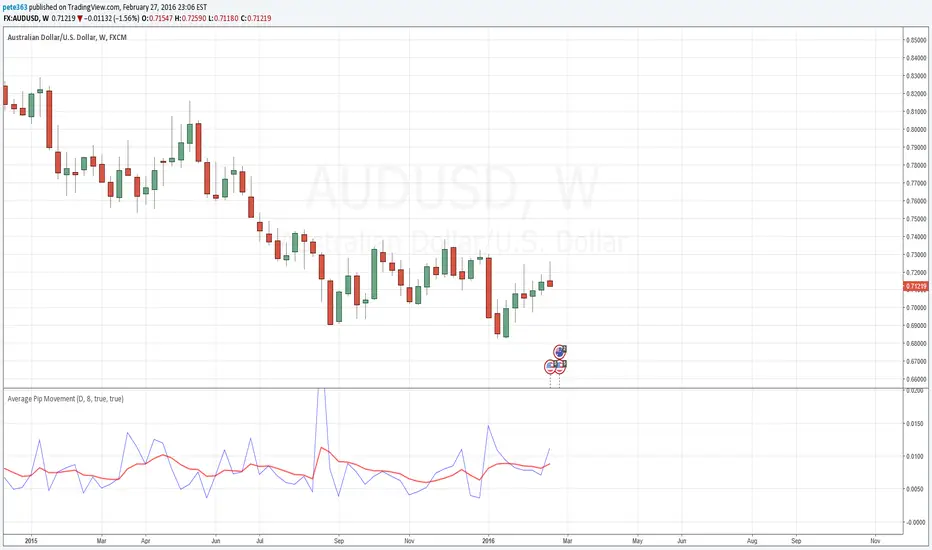
Average Price Movement inidcator displays the high/low for the period over time. On top of that an 8 period exponential moving avergae is attached
to get average movement over time. It provides, for eg. on a Daily chart, gives a day range and this can be used to book profits or place stop loss.
It is very simple indicator to provide price range over time.
to get average movement over time. It provides, for eg. on a Daily chart, gives a day range and this can be used to book profits or place stop loss.
It is very simple indicator to provide price range over time.
開源腳本
本著TradingView的真正精神,此腳本的創建者將其開源,以便交易者可以查看和驗證其功能。向作者致敬!雖然您可以免費使用它,但請記住,重新發佈程式碼必須遵守我們的網站規則。
免責聲明
這些資訊和出版物並不意味著也不構成TradingView提供或認可的金融、投資、交易或其他類型的意見或建議。請在使用條款閱讀更多資訊。
免責聲明
這些資訊和出版物並不意味著也不構成TradingView提供或認可的金融、投資、交易或其他類型的意見或建議。請在使用條款閱讀更多資訊。