OPEN-SOURCE SCRIPT
RSI Long Term
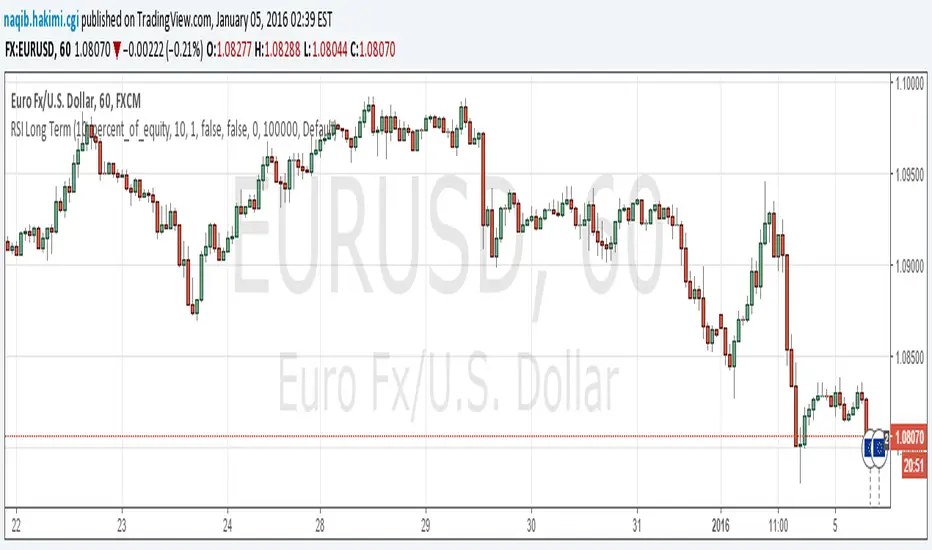
This strategy work good with long term ?
but only can check this in 9 month's
i am still working to see if it really works on 10 year data ( actually i still do not know how to do that in this site any idea ?)
and increase the trade number
but only can check this in 9 month's
i am still working to see if it really works on 10 year data ( actually i still do not know how to do that in this site any idea ?)
and increase the trade number
開源腳本
本著TradingView的真正精神,此腳本的創建者將其開源,以便交易者可以查看和驗證其功能。向作者致敬!雖然您可以免費使用它,但請記住,重新發佈程式碼必須遵守我們的網站規則。
免責聲明
這些資訊和出版物並不意味著也不構成TradingView提供或認可的金融、投資、交易或其他類型的意見或建議。請在使用條款閱讀更多資訊。
開源腳本
本著TradingView的真正精神,此腳本的創建者將其開源,以便交易者可以查看和驗證其功能。向作者致敬!雖然您可以免費使用它,但請記住,重新發佈程式碼必須遵守我們的網站規則。
免責聲明
這些資訊和出版物並不意味著也不構成TradingView提供或認可的金融、投資、交易或其他類型的意見或建議。請在使用條款閱讀更多資訊。