PROTECTED SOURCE SCRIPT
Megazones
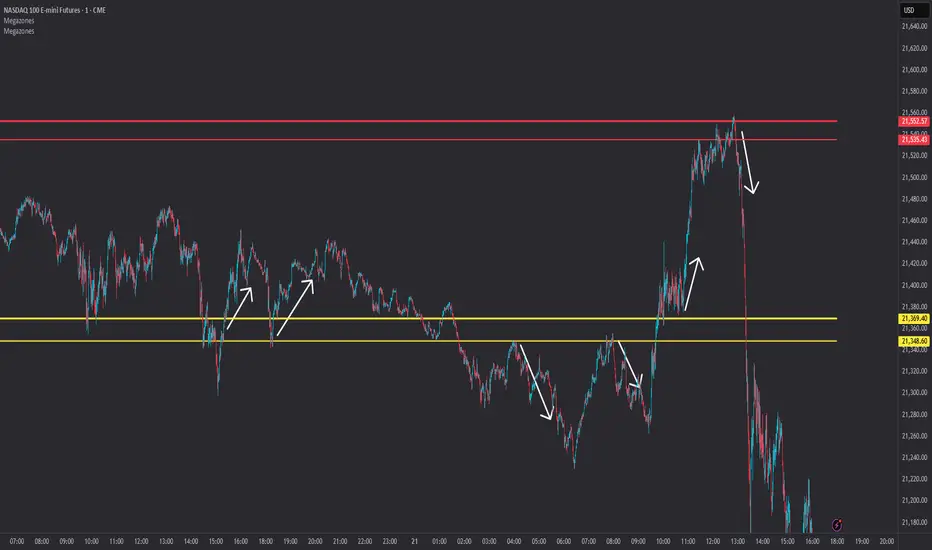
📦 Megazones — Auto-Expanding Range Detection
Megazones is a dynamic tool that detects price expansion ranges based on pivot structure. It automatically plots a pair of horizontal lines when both pivot highs and pivot lows are expanding — signaling directional strength and potential breakout zones.
🧠 How It Works:
- Pivot Detection: The script finds local highs/lows using a configurable Pivot Lookback length.
- Expansion Logic: It checks for consecutive higher highs and higher lows (configurable count).
- Zone Projection: When both expansions are detected, it draws a fading "zone" using two horizontal lines based on the latest pivot high and low.
⚙️ Settings:
- Pivot Lookback: How far left/right to confirm a pivot.
- Expansion Detection Window: How many bars back to keep pivots in memory.
- Min Expanding Highs/Lows: How many higher highs/lows must occur in a row to trigger zone detection.
🔍 Key Concept:
It identifies moments when the market is forming a structured expansion, where both higher highs and higher lows appear sequentially — suggesting potential breakout pressure or momentum continuation.
✅ Use Cases:
- Visual confirmation of building bullish structure.
- Anticipating breakout areas from clean expansion phases.
- Identifying trend-following continuation zones.
受保護腳本
此腳本以閉源形式發佈。 不過,您可以自由使用,沒有任何限制 — 點擊此處了解更多。
免責聲明
這些資訊和出版物並非旨在提供,也不構成TradingView提供或認可的任何形式的財務、投資、交易或其他類型的建議或推薦。請閱讀使用條款以了解更多資訊。
免責聲明
這些資訊和出版物並非旨在提供,也不構成TradingView提供或認可的任何形式的財務、投資、交易或其他類型的建議或推薦。請閱讀使用條款以了解更多資訊。