PROTECTED SOURCE SCRIPT
[DEM] Donchian Oscillator
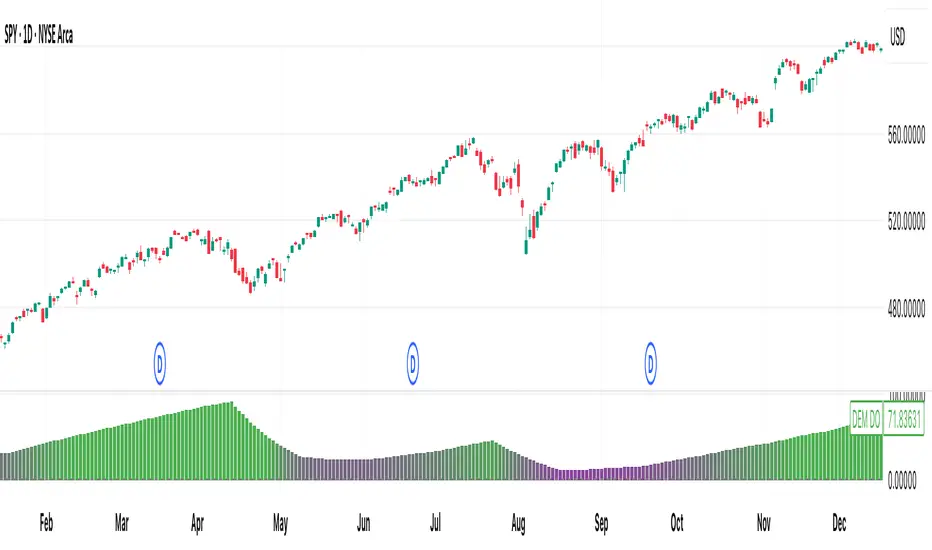
[DEM] Donchian Oscillator is designed to measure the relative position of recent price action within the Donchian Channel by calculating how many bars have passed since the most recent highest high versus the most recent lowest low over a specified lookback period. The indicator computes the difference between bars since the last low and bars since the last high, then applies smoothing using an RMA to create an oscillator that fluctuates around a zero centerline displayed in a separate pane below the main chart. The oscillator uses gradient coloring from red (negative values indicating recent lows dominate) through purple (neutral) to green (positive values indicating recent highs dominate), helping traders identify momentum shifts and potential overbought/oversold conditions based on whether price is closer to making new highs or new lows within the specified range.
受保護腳本
此腳本以閉源形式發佈。 不過,您可以自由使用,沒有任何限制 — 點擊此處了解更多。
免責聲明
這些資訊和出版物並非旨在提供,也不構成TradingView提供或認可的任何形式的財務、投資、交易或其他類型的建議或推薦。請閱讀使用條款以了解更多資訊。
受保護腳本
此腳本以閉源形式發佈。 不過,您可以自由使用,沒有任何限制 — 點擊此處了解更多。
免責聲明
這些資訊和出版物並非旨在提供,也不構成TradingView提供或認可的任何形式的財務、投資、交易或其他類型的建議或推薦。請閱讀使用條款以了解更多資訊。