INVITE-ONLY SCRIPT
已更新 USI Quantum Pulse PRO
RSI is a great tool used by many traders. However, it can be frustrating due to false signals that come with it. Ultimate Strength Index (USI) Quantum Pulse PRO tries to eliminate the frustrations. Using multiple lengths, it measures the strength of the instrument being traded at different segments of time. It can be used in few ways: It can be used as a help with entry and exit points when the lines cross, or it can be used to check the current trend, to take potential trades in the direction of overall trend.
-Components of the Script:
The script is composed of Ultimate Strength Index, and 5 additional layers computed from the USI to smooth out price data and identify trends with greater accuracy.
The lines are color coded in order to easily see the bullish and bearish momentum. If the line locations from top to bottom are in order of: Red, Orange, Yellow, Green, Blue (ROYGB) it is bullish structure. If it is in order of Blue, Green, Yellow, Orange, Red (GBYOR) it is a bearish structure.
-How to Use the Indicator:
1. Long/Short Entries based on crossovers:
-When the red line (Length 1 of USI) is under the other lines, and then crosses above the other 4 lines, it is considered a Buy signal.


-When the red line (Length 1 of USI) is above the other lines, and then crosses under the other 4 lines, it is considered a Sell signal.


2. It can be used as an indicator to show overall direction of the trend.
-All that needs to be done, is to increase the default lengths by the multiple factor.
-To Find Multiple Factor, you need to do the following
For example, you are watching a 15min chart, and you want to view a larger trend(Overall
Trend), lets say a 3hr chart.
-You can find the Multiple Factor to amplify the 15min chart to 3hr chart. To do that, convert the 3hr chart into min (180min) and then divide (180min : 15min) to get a Multiple Factor of 12.
-Then, you multiply the Multiple Factor by the default lengths, to see the 3hr chart USI on a 15 min chart. So, your Lengths would be adjusted as follows:
Default USI Length (13) x Multiple Factor (12) = 156. So USI Length would be set to 156
Default Length 1 of USI (11) x Multiple Factor(12) = 132. So USI Length would be set to 132
Default Length 2 of USI (7) x Multiple Factor(12) - 84. So USI Length would be set to 84.
Multiply the rest of the USI Lengths (Length 3, 4 and 5) by Multiple Factor of 12, to get 3hr
results.
3HR Results on a 15min Chart:

As seen above, you can now see an overall trend of RIVN on a 15min chart, by looking at the 3HR chart equivalent to gauge if stock's overall direction is either up or down, and take the trades in the direction of the trend.
12HR Chart on a 1HR chart:

As seen above, using the same settings as the prior example of 15min (156, 132, 84, 60, 60, 36) you can now see the 12HR overall trend, on a 1HR chart. It helps see the overall trend and to pick the side (long or short) based on that trend.
5min View of a 2HR Chart of NVDA:

As seen above, by Dividing 2HRs(120min) : 5min(Chart Being Viewed), you get a factor of 24. By multiplying the default lengths by 24, you get the following lines above from top to bottom (312, 264, 168, 120, 120, 72). These lines help see the overall direction of the stock and pick the sides (long/short) according to the trend.
ADVANCED FILTERING:
Finally, you can combine 2 USI indicators together, to turn it into a strategy using this indicator only.
1st USI indicator shows the overall trend using a larger time frame lines by multiplying the default lengths by the multiple factor.
2nd USI indicator shows the entries/exits using the default lengths.
Rules for 2 USI Strategy:
1. Long Entry:
Enter Long when 1st USI is showing that longer time frame is going up (Lines are lined up in the following order of Red, Orange, Yellow, Green, Blue) and in USI 2 red line crosses above all other lines.
NOTE: Uptrend BEGINS when the red line crosses above all other lines, not when the lines are positioned in the order of ROYGB


2. Short Entry:
Enter Short when the 1st USI is showing that longer time frame is going down (Lines are positioned in the following order of Blue, Green, Yellow, Orange, Red) and in USI 2, red line crosses below all other lines.
NOTE: Downtrend BEGINS when the red line crosses below other lines, not when the lines are positioned in the order of BGYOR.


-VERY IMPORTANT
Please remember that no indicator or script can guarantee success, and its effectiveness may change according to market conditions, as past results do not indicate future performance. Always consider your risk tolerance and investment goals before trading. Always back-test your trades to ensure that your trading is profitable before trading live.
-Components of the Script:
The script is composed of Ultimate Strength Index, and 5 additional layers computed from the USI to smooth out price data and identify trends with greater accuracy.
The lines are color coded in order to easily see the bullish and bearish momentum. If the line locations from top to bottom are in order of: Red, Orange, Yellow, Green, Blue (ROYGB) it is bullish structure. If it is in order of Blue, Green, Yellow, Orange, Red (GBYOR) it is a bearish structure.
-How to Use the Indicator:
1. Long/Short Entries based on crossovers:
-When the red line (Length 1 of USI) is under the other lines, and then crosses above the other 4 lines, it is considered a Buy signal.
-When the red line (Length 1 of USI) is above the other lines, and then crosses under the other 4 lines, it is considered a Sell signal.
2. It can be used as an indicator to show overall direction of the trend.
-All that needs to be done, is to increase the default lengths by the multiple factor.
-To Find Multiple Factor, you need to do the following
For example, you are watching a 15min chart, and you want to view a larger trend(Overall
Trend), lets say a 3hr chart.
-You can find the Multiple Factor to amplify the 15min chart to 3hr chart. To do that, convert the 3hr chart into min (180min) and then divide (180min : 15min) to get a Multiple Factor of 12.
-Then, you multiply the Multiple Factor by the default lengths, to see the 3hr chart USI on a 15 min chart. So, your Lengths would be adjusted as follows:
Default USI Length (13) x Multiple Factor (12) = 156. So USI Length would be set to 156
Default Length 1 of USI (11) x Multiple Factor(12) = 132. So USI Length would be set to 132
Default Length 2 of USI (7) x Multiple Factor(12) - 84. So USI Length would be set to 84.
Multiply the rest of the USI Lengths (Length 3, 4 and 5) by Multiple Factor of 12, to get 3hr
results.
3HR Results on a 15min Chart:
As seen above, you can now see an overall trend of RIVN on a 15min chart, by looking at the 3HR chart equivalent to gauge if stock's overall direction is either up or down, and take the trades in the direction of the trend.
12HR Chart on a 1HR chart:
As seen above, using the same settings as the prior example of 15min (156, 132, 84, 60, 60, 36) you can now see the 12HR overall trend, on a 1HR chart. It helps see the overall trend and to pick the side (long or short) based on that trend.
5min View of a 2HR Chart of NVDA:
As seen above, by Dividing 2HRs(120min) : 5min(Chart Being Viewed), you get a factor of 24. By multiplying the default lengths by 24, you get the following lines above from top to bottom (312, 264, 168, 120, 120, 72). These lines help see the overall direction of the stock and pick the sides (long/short) according to the trend.
ADVANCED FILTERING:
Finally, you can combine 2 USI indicators together, to turn it into a strategy using this indicator only.
1st USI indicator shows the overall trend using a larger time frame lines by multiplying the default lengths by the multiple factor.
2nd USI indicator shows the entries/exits using the default lengths.
Rules for 2 USI Strategy:
1. Long Entry:
Enter Long when 1st USI is showing that longer time frame is going up (Lines are lined up in the following order of Red, Orange, Yellow, Green, Blue) and in USI 2 red line crosses above all other lines.
NOTE: Uptrend BEGINS when the red line crosses above all other lines, not when the lines are positioned in the order of ROYGB
2. Short Entry:
Enter Short when the 1st USI is showing that longer time frame is going down (Lines are positioned in the following order of Blue, Green, Yellow, Orange, Red) and in USI 2, red line crosses below all other lines.
NOTE: Downtrend BEGINS when the red line crosses below other lines, not when the lines are positioned in the order of BGYOR.
-VERY IMPORTANT
Please remember that no indicator or script can guarantee success, and its effectiveness may change according to market conditions, as past results do not indicate future performance. Always consider your risk tolerance and investment goals before trading. Always back-test your trades to ensure that your trading is profitable before trading live.
發行說明
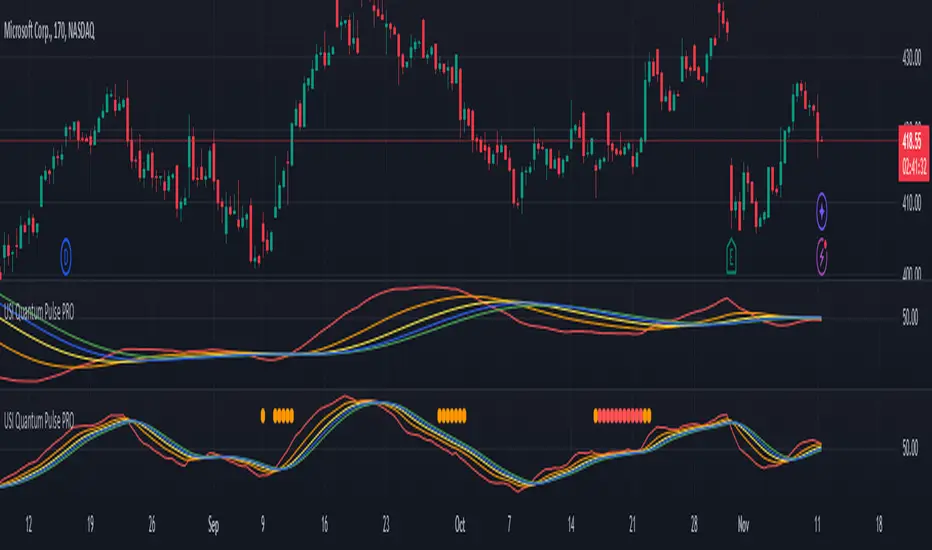
Update to Script: Added consolidation areas to the script, to show low volatility, sideways areas before the breakouts happen.
Dots show the consolidation areas, and the USI Quantum Pulse PRO helps with the breakout direction.
發行說明
Update V3Alerts have been added to the script. So now, you can let Tradingview to find you the potential areas of entry, and you can use Zero-Lag USI for timing of these entries.
-Long USI Condition: This is an alert that shows areas where USI Quantum Pulse Pro is in consolidation (Dots are active) and lines are stacked in an uptrend (Line Colors in order of ROYBG).
-Short USI Condition: This is an alert that shows areas where USI Quantum Pulse Pro is in consolidation (Dots are active) and the lines are stacked in a downtrend (Line Colors in order of GBYOR).
To create an alert, simply
1. Go to the chart, choose desired instrument on a desired time frame with the desired USI Lengths
2. Click on a "Create Alert" Button on the toolbar above the chart. (Alternative Keyboard Shortcut: "Alt" + A)
3. In the "Condition" Section Find USI Quantum Pulse PRO
4. Below the "Condition" Section, choose "Long USI Condition" or "Short USI Condition" depending on what you are looking to do, go long or go short.
發行說明
Update V4 (10/3/2025)-Added an alert condition "In Consolidation." Now you have an option to find areas of consolidation only, WITHOUT the USI line direction.
僅限邀請腳本
僅作者批准的使用者才能訪問此腳本。您需要申請並獲得使用許可,通常需在付款後才能取得。更多詳情,請依照作者以下的指示操作,或直接聯絡ADmytrenko2。
請注意,此私人、僅限受邀使用者使用的腳本未經腳本審核員審核,其是否符合社群規範尚待確定。 TradingView不建議在未完全信任作者並了解其運作方式的情況下購買或使用腳本。您也可以在我們的社群腳本中找到免費的開源替代方案。
作者的說明
DM Me for a Free 7-Day Trial
免責聲明
這些資訊和出版物並非旨在提供,也不構成TradingView提供或認可的任何形式的財務、投資、交易或其他類型的建議或推薦。請閱讀使用條款以了解更多資訊。