OPEN-SOURCE SCRIPT
Linear Regression Slope - Version 2
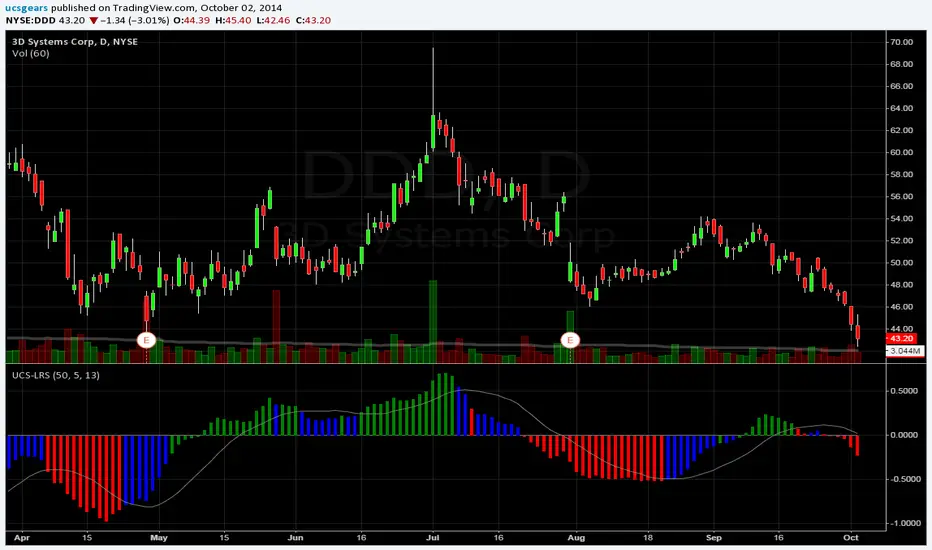
Version 2 - Linear Regression Slope. This version will have more freedom on picking your own length for all the Inputs.
One of the main reason I changed it is because, Slope calculation on transition period was not being computed properly. Because the Version 1, looks back the length assigned, and compute the slope based on two candle readings, could be 10 days apart or 50. That was misleading.
Therefore, I changed it to plot daily slope and Smooth it with an EMA.
Linear Regression Curve - tradingview.com/v/JojPxTRD/
List of All my Indicators - tradingview.com/p/stocks/?sort=recent&time=day&by=ucsgears
開源腳本
本著TradingView的真正精神,此腳本的創建者將其開源,以便交易者可以查看和驗證其功能。向作者致敬!雖然您可以免費使用它,但請記住,重新發佈程式碼必須遵守我們的網站規則。
Uday C Santhakumar
免責聲明
這些資訊和出版物並不意味著也不構成TradingView提供或認可的金融、投資、交易或其他類型的意見或建議。請在使用條款閱讀更多資訊。
開源腳本
本著TradingView的真正精神,此腳本的創建者將其開源,以便交易者可以查看和驗證其功能。向作者致敬!雖然您可以免費使用它,但請記住,重新發佈程式碼必須遵守我們的網站規則。
Uday C Santhakumar
免責聲明
這些資訊和出版物並不意味著也不構成TradingView提供或認可的金融、投資、交易或其他類型的意見或建議。請在使用條款閱讀更多資訊。