PROTECTED SOURCE SCRIPT
Nadaraya-Watson Envelope & RSI & Stoch RSI - Step 2
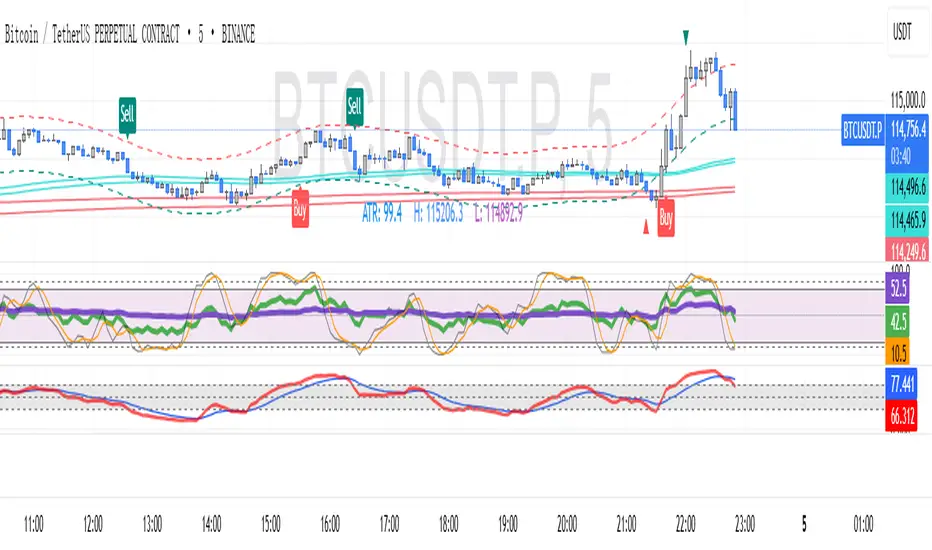
A compact and effective momentum confirmation tool designed to validate price-based entries using dual RSI and smoothed Stochastic RSI structures.
🧠 Why Combine RSI and StochRSI?
This script blends two levels of RSI analysis to help traders assess overbought/oversold conditions and detect early reversal signals:
The dual RSI structure provides a fast-vs-slow momentum comparison, offering both short-term timing and longer-term trend sensitivity.
The StochRSI module helps confirm reversal setups with smoother K/D crossovers.
Background zone shading enhances visibility of exhaustion areas.
These combined tools serve as a secondary validation layer, perfect for scalpers and swing traders using price-based strategies.
🔍 Feature Modules
🟢 Dual RSI
Fast and slow RSI lines plotted together for comparative strength tracking.
Shaded zone between typical exhaustion levels (e.g., 30~70) to highlight potential mean reversions.
🟠 Stochastic RSI
Uses smoothed K & D lines based on a short RSI input.
Visual aids include:
Extreme zones (e.g., 30 / 70)
Midline for trend bias (50)
Transparent fills to highlight oversold/overbought cross events.
⚙️ Suggested Use Cases
Use RSI divergence or alignment to confirm entries from your main price action strategy.
Monitor K/D crossover signals to fine-tune entry or exit timing.
Filter fakeouts by requiring agreement across all three signals (Fast RSI, Slow RSI, and StochRSI).
✅ Originality Statement
This script isn't just a visual mashup of indicators—it carefully integrates multiple layers of RSI logic to build confidence for timing trades in volatile or ranging markets.
⚠️ Disclaimer
This tool is for research and educational purposes only. It is not financial advice. Trading involves risk. Use at your own discretion.
受保護腳本
此腳本以閉源形式發佈。 不過,您可以自由使用,沒有任何限制 — 點擊此處了解更多。
新用戶用以下連結註冊可享 $15 優惠
tw.tradingview.com/black-friday/?share_your_love=jia1109
tw.tradingview.com/black-friday/?share_your_love=jia1109
免責聲明
這些資訊和出版物並非旨在提供,也不構成TradingView提供或認可的任何形式的財務、投資、交易或其他類型的建議或推薦。請閱讀使用條款以了解更多資訊。
受保護腳本
此腳本以閉源形式發佈。 不過,您可以自由使用,沒有任何限制 — 點擊此處了解更多。
新用戶用以下連結註冊可享 $15 優惠
tw.tradingview.com/black-friday/?share_your_love=jia1109
tw.tradingview.com/black-friday/?share_your_love=jia1109
免責聲明
這些資訊和出版物並非旨在提供,也不構成TradingView提供或認可的任何形式的財務、投資、交易或其他類型的建議或推薦。請閱讀使用條款以了解更多資訊。