IldarAkhmetgaleev

Commodity channel index x2 v1

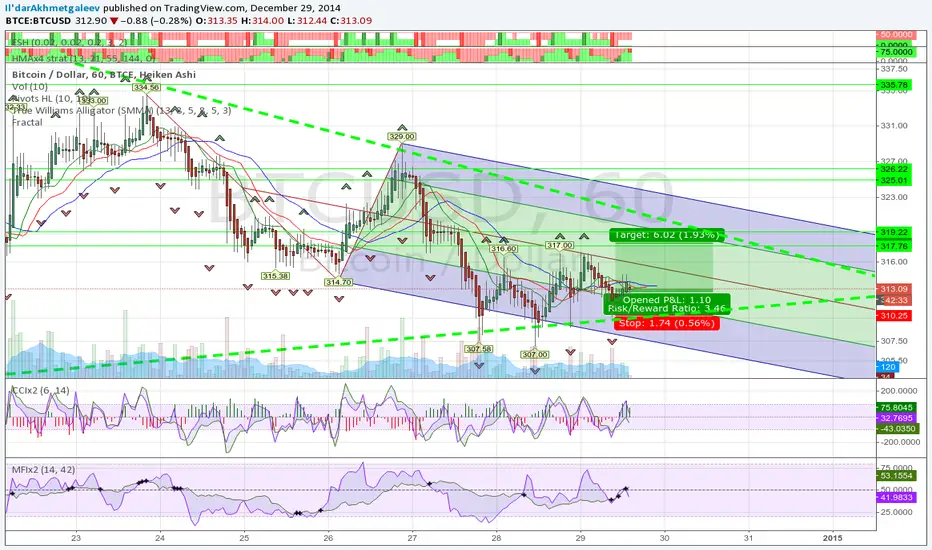
Slightly enhenced CCI. Take a look how difference between slow and fast CCI displayed as histogram can predict possible reverse.
EDIT: fast = 14, slow = 28 works better.
開源腳本

本著真正的TradingView精神,該腳本的作者將其開源發布,以便交易者可以理解和驗證它。為作者喝彩吧!您可以免費使用它,但在出版物中重複使用此代碼受網站規則的約束。 您可以收藏它以在圖表上使用。

免責聲明

這些資訊和出版物並不意味著也不構成TradingView提供或認可的金融、投資、交易或其他類型的意見或建議。請在使用條款閱讀更多資訊。

想在圖表上使用此腳本?
study(title="Commodity Channel Index x2" , shorttitle='CCIx2')

fast_lenght = input(title="Fast CCI Length", type=integer, defval=6, minval=1)
slow_lenght = input(title="Slow CCI Length", type=integer, defval=14, minval=1)

source = close

fast_cci = cci(source, fast_lenght)
slow_cci = cci(source, slow_lenght)

hist = (fast_cci - slow_cci)
hist_color = hist > 0 ? green : red

hline(0, title="Zero Line", color=gray, linestyle=dotted)
overbought = hline(100, title="Positive Line", color=gray, linestyle=dotted)
oversold = hline(-100, title="Negative Line", color=gray, linestyle=dotted)
fill(overbought, oversold, color=#9915ff, transp=90)

plot(hist, color=hist_color, title='Difference', style=histogram)
fast_line = plot(fast_cci, color=#9922ff, title='Fast CCI')
slow_line = plot(slow_cci, color=#447711, title='Slow CCI')
fill(fast_line, slow_line, color=#004499, transp=90)