OPEN-SOURCE SCRIPT
Candle and BG Trend Identifier
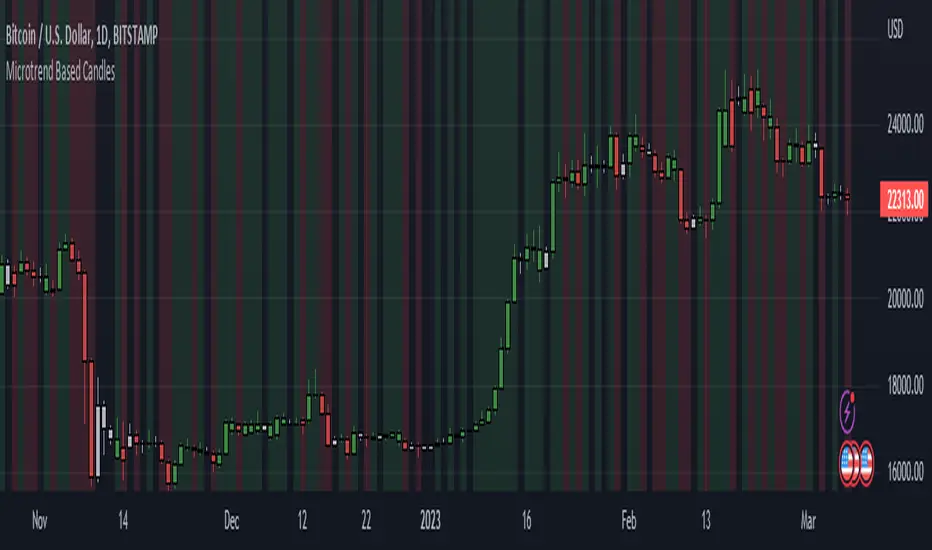
This indicator simply changes the background and color of candle based on the previous candle's close. If a candle closes high than the previous candle's high it will be indicated via green coloring. If a candle closes lower than the previous candle's low it will be indicated in red coloring. Additionally, grey colored candles appear when neither occur - often signifying consolidation.
These candles can be used to identify previous small lasting and long ranging trends. Areas that are heavily saturated with one specific color will likely indicate a trend.
If you are not able to see the colored candles, disable your main candle overlay in the top left by clicking on the eye icon.
These candles can be used to identify previous small lasting and long ranging trends. Areas that are heavily saturated with one specific color will likely indicate a trend.
If you are not able to see the colored candles, disable your main candle overlay in the top left by clicking on the eye icon.
開源腳本
秉持TradingView一貫精神,這個腳本的創作者將其設為開源,以便交易者檢視並驗證其功能。向作者致敬!您可以免費使用此腳本,但請注意,重新發佈代碼需遵守我們的社群規範。
免責聲明
這些資訊和出版物並非旨在提供,也不構成TradingView提供或認可的任何形式的財務、投資、交易或其他類型的建議或推薦。請閱讀使用條款以了解更多資訊。
開源腳本
秉持TradingView一貫精神,這個腳本的創作者將其設為開源,以便交易者檢視並驗證其功能。向作者致敬!您可以免費使用此腳本,但請注意,重新發佈代碼需遵守我們的社群規範。
免責聲明
這些資訊和出版物並非旨在提供,也不構成TradingView提供或認可的任何形式的財務、投資、交易或其他類型的建議或推薦。請閱讀使用條款以了解更多資訊。