OPEN-SOURCE SCRIPT
已更新 season
This script is meant to help verify the existence of a seasonal effect in asset returns, using a Z-test. There are three steps:
1. Think of a way to identify a season. The available methods are: by month, by week of the year, by day of the month, by day of the week, by hour of the day, and by minute of the hour.
2. Set the chart to the unit of your season. For example, if you want to check whether a crop commodity's harvest season has a seasonal implication, select "month". If you want to investigate the exchange's opening or close, select "hour".
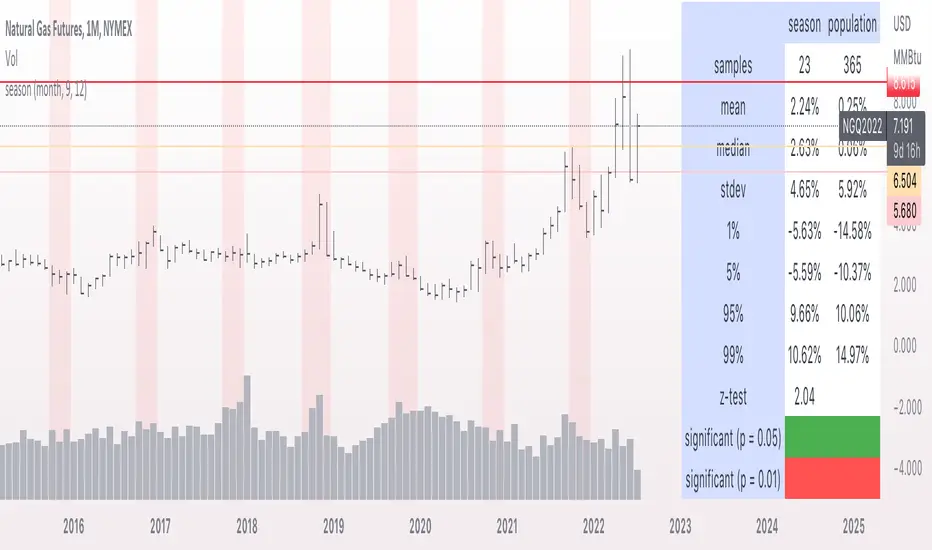
3. Using the inputs, select the unit (e.g. "month", "dayofweek", "hour", etc.) and the range that identifies the season. The example natural gas chart has set "start" to 8 and "end" to 12 for September through December.
The test logic is as follows:
The "season" you select has a fixed length; for example, months eight through twelve has a length of four. This length is used to compute a sample mean, which is the mean return of all September-December periods in the chart. It is also used to calculate the mean/stdev of every other four-month period in the chart history. The latter is considered the "population." Using a Z-test, the script scores the difference between the sample returns and the population returns, and displays the results at two levels of significance (P = 0.05 and P = 0.01). The null hypothesis is "there is no difference between the seasonal periods and the population of ordinary periods". If the Z-score is sufficiently large or small, we can reject the null hypothesis and say that there is a seasonal effect at the given level of confidence. The output table will show green for a rejection of the null hypothesis (meaning there is a seasonal effect) or red of acceptance (there is no seasonal effect).
The seasonal periods that you have defined will be highlighted on the chart, so you can make sure they are correct. Additionally, the output table shows the mean, median, standard deviation, and top and bottom percentiles for both the seasonal and population samples.
Many news sites, twitter feeds, influences, etc. enjoy posting statistics about past returns, like "the stock market has gone up on this day 85 out of the past 100 years" and so on. Unfortunately, these posts don't tell you that many of these statistics are meaningless, as even totally random price fluctuations will cause many such interesting figures to occur. This script provides a limited means of testing some such seasonal effects so you can see if they are probably just random, or if they may have some meaning.
Note that Tradingview seems to use 1-based indexing for daily or higher timeframes, and 0-based indexing for intraday timeframes:
Months: 1-12
Weeks: 1-52
Days (of month): 1-31
Days (of week): 1-7
Hours (of day): 0-23
Minutes (of hour): 0-59
1. Think of a way to identify a season. The available methods are: by month, by week of the year, by day of the month, by day of the week, by hour of the day, and by minute of the hour.
2. Set the chart to the unit of your season. For example, if you want to check whether a crop commodity's harvest season has a seasonal implication, select "month". If you want to investigate the exchange's opening or close, select "hour".
3. Using the inputs, select the unit (e.g. "month", "dayofweek", "hour", etc.) and the range that identifies the season. The example natural gas chart has set "start" to 8 and "end" to 12 for September through December.
The test logic is as follows:
The "season" you select has a fixed length; for example, months eight through twelve has a length of four. This length is used to compute a sample mean, which is the mean return of all September-December periods in the chart. It is also used to calculate the mean/stdev of every other four-month period in the chart history. The latter is considered the "population." Using a Z-test, the script scores the difference between the sample returns and the population returns, and displays the results at two levels of significance (P = 0.05 and P = 0.01). The null hypothesis is "there is no difference between the seasonal periods and the population of ordinary periods". If the Z-score is sufficiently large or small, we can reject the null hypothesis and say that there is a seasonal effect at the given level of confidence. The output table will show green for a rejection of the null hypothesis (meaning there is a seasonal effect) or red of acceptance (there is no seasonal effect).
The seasonal periods that you have defined will be highlighted on the chart, so you can make sure they are correct. Additionally, the output table shows the mean, median, standard deviation, and top and bottom percentiles for both the seasonal and population samples.
Many news sites, twitter feeds, influences, etc. enjoy posting statistics about past returns, like "the stock market has gone up on this day 85 out of the past 100 years" and so on. Unfortunately, these posts don't tell you that many of these statistics are meaningless, as even totally random price fluctuations will cause many such interesting figures to occur. This script provides a limited means of testing some such seasonal effects so you can see if they are probably just random, or if they may have some meaning.
Note that Tradingview seems to use 1-based indexing for daily or higher timeframes, and 0-based indexing for intraday timeframes:
Months: 1-12
Weeks: 1-52
Days (of month): 1-31
Days (of week): 1-7
Hours (of day): 0-23
Minutes (of hour): 0-59
發行說明
- added an option (disabled by default) to label each season's return. however, it doesn't seem to work very well for some reason... beta feature!發行說明
corrected sampling distribution開源腳本
本著TradingView的真正精神,此腳本的創建者將其開源,以便交易者可以查看和驗證其功能。向作者致敬!雖然您可以免費使用它,但請記住,重新發佈程式碼必須遵守我們的網站規則。
免責聲明
這些資訊和出版物並不意味著也不構成TradingView提供或認可的金融、投資、交易或其他類型的意見或建議。請在使用條款閱讀更多資訊。
開源腳本
本著TradingView的真正精神,此腳本的創建者將其開源,以便交易者可以查看和驗證其功能。向作者致敬!雖然您可以免費使用它,但請記住,重新發佈程式碼必須遵守我們的網站規則。
免責聲明
這些資訊和出版物並不意味著也不構成TradingView提供或認可的金融、投資、交易或其他類型的意見或建議。請在使用條款閱讀更多資訊。