OPEN-SOURCE SCRIPT
Global vs National Index Spread RSI
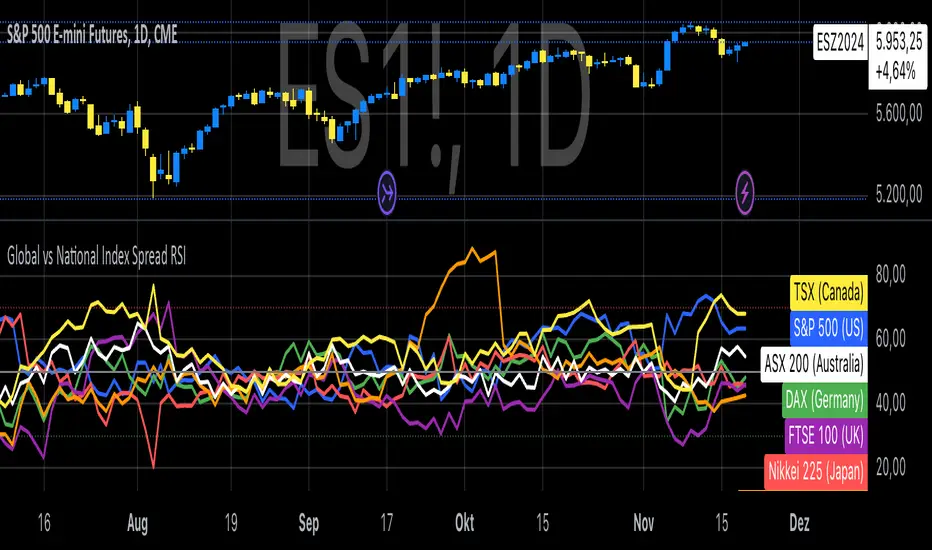
The Global vs National Index Spread RSI indicator visualizes the relative strength of national stock indices compared to a global benchmark (e.g., AMEX). It calculates the percentage spread between the closing prices of each national index and the global index, applying the Relative Strength Index (RSI) to each spread.
How It Works
Spread Calculation: The spread represents the percentage difference between a national index and the global index.
RSI Application: RSI is applied to these spreads to identify overbought or oversold conditions in the relative performance of the national indices.
Reference Lines: Overbought (70), oversold (30), and neutral (50) levels help guide interpretation.
Insights from Research
The correlation between global and national indices provides insights into market integration and interdependence. Studies such as Forbes & Rigobon (2002) emphasize the importance of understanding these linkages during periods of financial contagion. Observing spread trends with RSI can aid in identifying shifts in investor sentiment and regional performance anomalies.
Use Cases
- Detect divergences between national and global markets.
- Identify overbought or oversold conditions for specific indices.
- Complement portfolio management strategies by monitoring geographic performance.
References
Forbes, K. J., & Rigobon, R. (2002). "No contagion, only interdependence: Measuring stock market co-movements." Journal of Finance.
Eun, C. S., & Shim, S. (1989). "International transmission of stock market movements." Journal of Financial and Quantitative Analysis.
開源腳本
秉持TradingView一貫精神,這個腳本的創作者將其設為開源,以便交易者檢視並驗證其功能。向作者致敬!您可以免費使用此腳本,但請注意,重新發佈代碼需遵守我們的社群規範。
Where others speculate, we systematize.
edgetools.org
edgetools.org
免責聲明
這些資訊和出版物並非旨在提供,也不構成TradingView提供或認可的任何形式的財務、投資、交易或其他類型的建議或推薦。請閱讀使用條款以了解更多資訊。
開源腳本
秉持TradingView一貫精神,這個腳本的創作者將其設為開源,以便交易者檢視並驗證其功能。向作者致敬!您可以免費使用此腳本,但請注意,重新發佈代碼需遵守我們的社群規範。
Where others speculate, we systematize.
edgetools.org
edgetools.org
免責聲明
這些資訊和出版物並非旨在提供,也不構成TradingView提供或認可的任何形式的財務、投資、交易或其他類型的建議或推薦。請閱讀使用條款以了解更多資訊。