INVITE-ONLY SCRIPT
已更新 [DisDev] Market Maker | Sessions | Initial Balance | Range Stats
This indicator has two main components: Time-Specific Sessions and High/Low Statistics. There are also several subcomponents: Day of Week Separators, Specific Session High/Low Extenders, Day Range Statistics, Week Range Statistics, User Input Session Titles, etc.
Each component is explained and demonstrated how it could be utilized as a trading tool.
The basis of this indicator is to analyze session-specific price movements through automatic display and statistics.
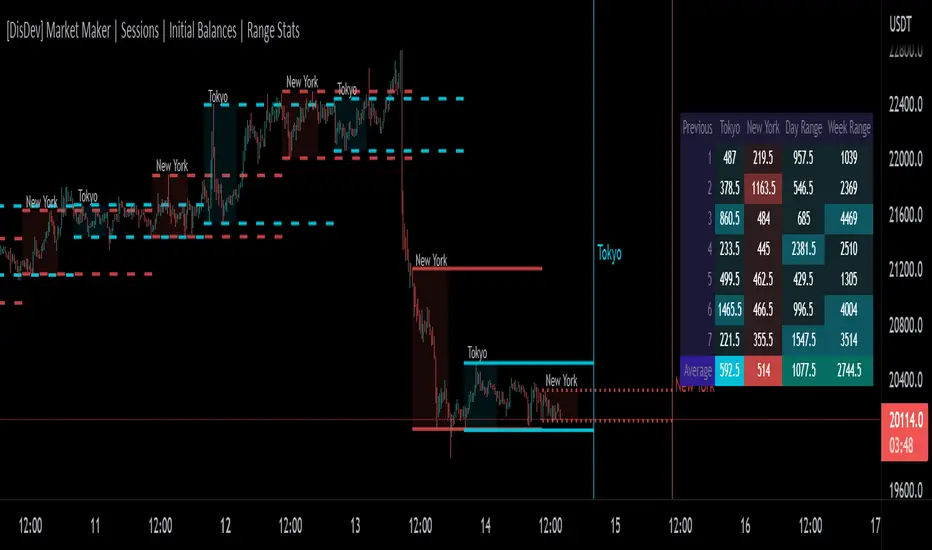
Key:
Dotted lines = Developing Session
Solid Line = Session complete
Dashed lines = Past Session
1) The primary function is the five manual time-session inputs. These sessions could be based on a full market period, such as London Open to Close (0800 UTC to 1630 UTC), the Initial Balance of the day (0000 UTC to 0100 UTC), or a session Initial Balance New York (1430 UTC to 1530 UTC). The user can update settings input text to reflect this on the chart.
The following shows the example noted above, with the added subcomponents of:
• Shaded areas to define each session
• Extension of the Sessions highs and lows (extension 24/48/72-hour options)
• Future line projection (provides a reminder of when the market opens)
This allows you to see potential levels of resistance and support and market open volatility.

The below example shows the input sessions configured for five Session Initial Balances. You can see that the Sessions Initial Balances were in a tight price range. A range breakout occurred with price move of $1400 visualized.

2) The secondary function is the Range statistics. Range statistics can be used to track the volatility of each session, day or week and can be selected for up to 31 days. This helps the user to determine overbought or oversold conditions as well as pattern recognition.

Trade Example 1
Settings: New York Session Open to Session Close.
The colored boxes are manually drawn to emphasize how the New York Lows and Highs can act as a confluence for support and resistance areas.

Trade Example 2a
Settings: London Session Open to Session Close and New York Session Open to Session Close.
This chart shows how the Session Open (in this case, the New York Open) reminder notifies you that there could be volatility when a new session opens.

Trade Example 2b
Notice how price breaks to the upside at the opening of the New York session. In this instance it was a $2,250 or 5.17% increase in the opening hour.

3. Once London closes New York has control of the market; one push-up stops out the shorts that placed stop losses at the London high, then brings price back down to the mean.
By having the reminder lines and shaded sessions, the user is prepared and can anticipate some price reaction, often a reversal if price has been steadily moving in one direction.

Each component is explained and demonstrated how it could be utilized as a trading tool.
The basis of this indicator is to analyze session-specific price movements through automatic display and statistics.
Key:
Dotted lines = Developing Session
Solid Line = Session complete
Dashed lines = Past Session
1) The primary function is the five manual time-session inputs. These sessions could be based on a full market period, such as London Open to Close (0800 UTC to 1630 UTC), the Initial Balance of the day (0000 UTC to 0100 UTC), or a session Initial Balance New York (1430 UTC to 1530 UTC). The user can update settings input text to reflect this on the chart.
The following shows the example noted above, with the added subcomponents of:
• Shaded areas to define each session
• Extension of the Sessions highs and lows (extension 24/48/72-hour options)
• Future line projection (provides a reminder of when the market opens)
This allows you to see potential levels of resistance and support and market open volatility.
The below example shows the input sessions configured for five Session Initial Balances. You can see that the Sessions Initial Balances were in a tight price range. A range breakout occurred with price move of $1400 visualized.
2) The secondary function is the Range statistics. Range statistics can be used to track the volatility of each session, day or week and can be selected for up to 31 days. This helps the user to determine overbought or oversold conditions as well as pattern recognition.
Trade Example 1
Settings: New York Session Open to Session Close.
The colored boxes are manually drawn to emphasize how the New York Lows and Highs can act as a confluence for support and resistance areas.
Trade Example 2a
Settings: London Session Open to Session Close and New York Session Open to Session Close.
This chart shows how the Session Open (in this case, the New York Open) reminder notifies you that there could be volatility when a new session opens.
Trade Example 2b
Notice how price breaks to the upside at the opening of the New York session. In this instance it was a $2,250 or 5.17% increase in the opening hour.
3. Once London closes New York has control of the market; one push-up stops out the shorts that placed stop losses at the London high, then brings price back down to the mean.
By having the reminder lines and shaded sessions, the user is prepared and can anticipate some price reaction, often a reversal if price has been steadily moving in one direction.
發行說明
Shade Session UpdateOption configured so the opacity of the Shade Session can be changed by the user.
發行說明
Code tweaks發行說明
Performance tweaks發行說明
Author Instruction Update.僅限邀請腳本
僅作者批准的使用者才能訪問此腳本。您需要申請並獲得使用許可,通常需在付款後才能取得。更多詳情,請依照作者以下的指示操作,或直接聯絡DisDev。
TradingView不建議在未完全信任作者並了解其運作方式的情況下購買或使用腳本。您也可以在我們的社群腳本中找到免費的開源替代方案。
作者的說明
Please visit https://disruptivedevelopers.com/market-maker/sessions-initial-balance-range-stats/ for more information on gaining access to this indicator and others.
免責聲明
這些資訊和出版物並非旨在提供,也不構成TradingView提供或認可的任何形式的財務、投資、交易或其他類型的建議或推薦。請閱讀使用條款以了解更多資訊。
僅限邀請腳本
僅作者批准的使用者才能訪問此腳本。您需要申請並獲得使用許可,通常需在付款後才能取得。更多詳情,請依照作者以下的指示操作,或直接聯絡DisDev。
TradingView不建議在未完全信任作者並了解其運作方式的情況下購買或使用腳本。您也可以在我們的社群腳本中找到免費的開源替代方案。
作者的說明
Please visit https://disruptivedevelopers.com/market-maker/sessions-initial-balance-range-stats/ for more information on gaining access to this indicator and others.
免責聲明
這些資訊和出版物並非旨在提供,也不構成TradingView提供或認可的任何形式的財務、投資、交易或其他類型的建議或推薦。請閱讀使用條款以了解更多資訊。