OPEN-SOURCE SCRIPT
已更新 switches [experimental / tools]

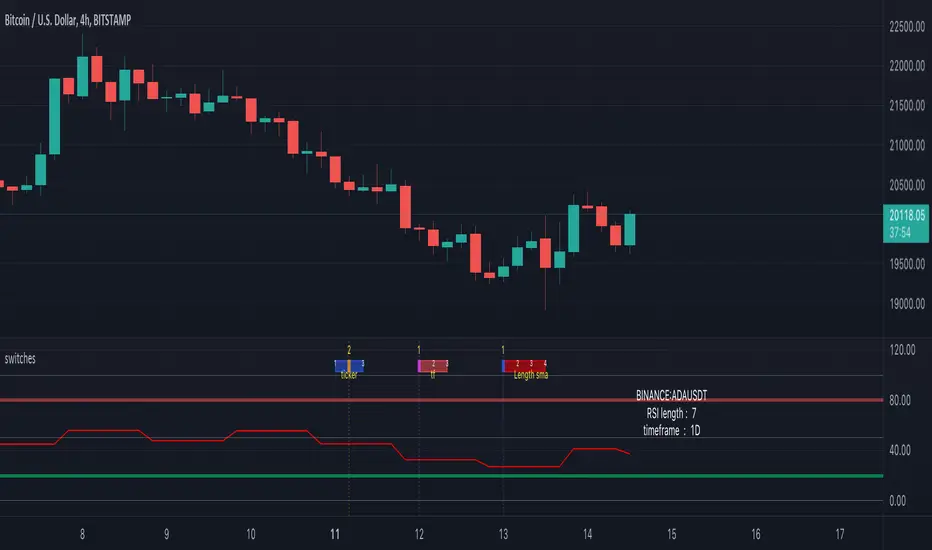
This scripts shows a tool which enables switching between settings without opening the settings
In this case you can switch between a RSI of 3 different tickers, 3 different higher timeframes, and 4 different lengths.
How does it work?
The position of a 'time line' is compared with the position of a box.
Changing the position of the line changes the settings.
The settings need to be set upfront though,
if you want to switch between length 7, 10, 14, 21 they need to be set first.
Example:
One wants to switch between RSI of SOLUSDT, ADAUSDT and FILUSDT

First set your tickers
-> Settings -> Set 1 -> Ticker
Then tap/click and move the line


And there you go!
The same with Timeframe and Length
Important:
It is not possible to automatically set the boxes/line at current time,
so these (settings -> date at Box, Line) need to be set in the beginning
Cheers!
In this case you can switch between a RSI of 3 different tickers, 3 different higher timeframes, and 4 different lengths.
How does it work?
The position of a 'time line' is compared with the position of a box.
Changing the position of the line changes the settings.
The settings need to be set upfront though,
if you want to switch between length 7, 10, 14, 21 they need to be set first.
Example:
One wants to switch between RSI of SOLUSDT, ADAUSDT and FILUSDT
First set your tickers
-> Settings -> Set 1 -> Ticker
Then tap/click and move the line
And there you go!
The same with Timeframe and Length
Important:
It is not possible to automatically set the boxes/line at current time,
so these (settings -> date at Box, Line) need to be set in the beginning
Cheers!
發行說明
Fixed potential repaintAlso:
Non-continue symbols (stocks, ... with no trades in weekend,...) can cause visual issues, due to the absence of certain dates.
發行說明
Added the new feature chart.left_visible_bar_time and chart.right_visible_bar_time so the 'box date' became unnecessary,now you only have to adjust the 'line date'
發行說明
This script is part of a collection of educational scriptsIf you want to return to the open source INDEX page, click here
-> Education: INDEX
開源腳本
In true TradingView spirit, the creator of this script has made it open-source, so that traders can review and verify its functionality. Kudos to the author! While you can use it for free, remember that republishing the code is subject to our House Rules.
Who are PineCoders?
tradingview.com/chart/SSP/yW5eOqtm-Who-are-PineCoders/
TG Pine Script® Q&A: t.me/PineCodersQA
- We cannot control our emotions,
but we can control our keyboard -
tradingview.com/chart/SSP/yW5eOqtm-Who-are-PineCoders/
TG Pine Script® Q&A: t.me/PineCodersQA
- We cannot control our emotions,
but we can control our keyboard -
免責聲明
The information and publications are not meant to be, and do not constitute, financial, investment, trading, or other types of advice or recommendations supplied or endorsed by TradingView. Read more in the Terms of Use.