PROTECTED SOURCE SCRIPT
[Vold] Trading Strategy
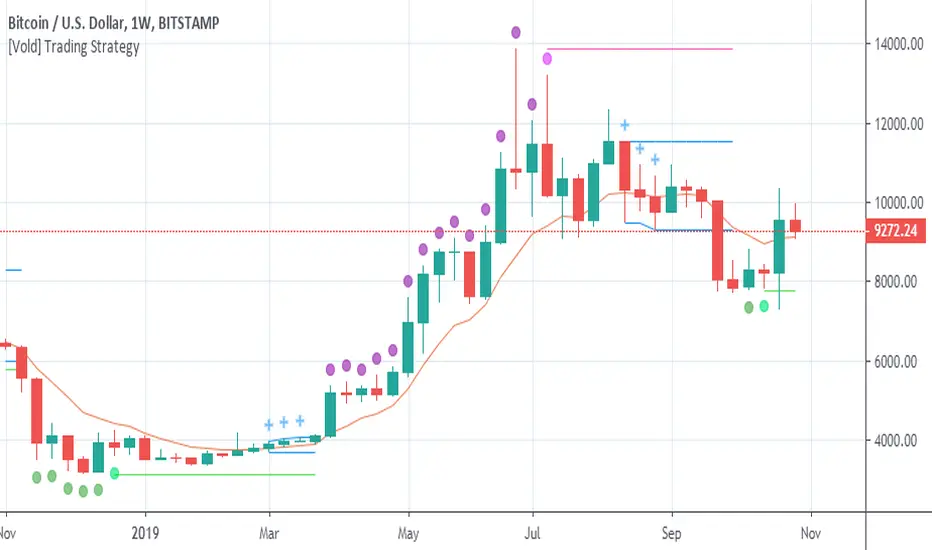
Green dot = Trending down.
Purple dot = Trending up.
Fuchsia dot = Uptrend ended.
Lime dot = Downtrend ended.
Fuchsia line = The highest value of the last trend (breaking it up means continuation.
Lime line = Idem fuchsia line but to the downside.
Blue crosses = Could be different things: 1. A dip to buy, 2. A rally to sell, 3. Building a range ...
Blue range = Depending on the direction it breaks, is the next direction.
Golden line = Candles above favour uptrends, Candles below favour downtrends, also works as support and resistance .
This trading strategy can be traded very mechanically (see this experiment here: tradingview.com/chart/BTCUSD...)
But I don't advice to do that, use it along with other indicators to make better decisions ( RSI for example) or volume of the trends and the end of them. Also, you can use higher timeframes to understand better the context.
受保護腳本
此腳本以閉源形式發佈。 不過,您可以自由使用,沒有任何限制 — 點擊此處了解更多。
免責聲明
這些資訊和出版物並非旨在提供,也不構成TradingView提供或認可的任何形式的財務、投資、交易或其他類型的建議或推薦。請閱讀使用條款以了解更多資訊。
免責聲明
這些資訊和出版物並非旨在提供,也不構成TradingView提供或認可的任何形式的財務、投資、交易或其他類型的建議或推薦。請閱讀使用條款以了解更多資訊。