PROTECTED SOURCE SCRIPT
AZ VP Scan 40% Area
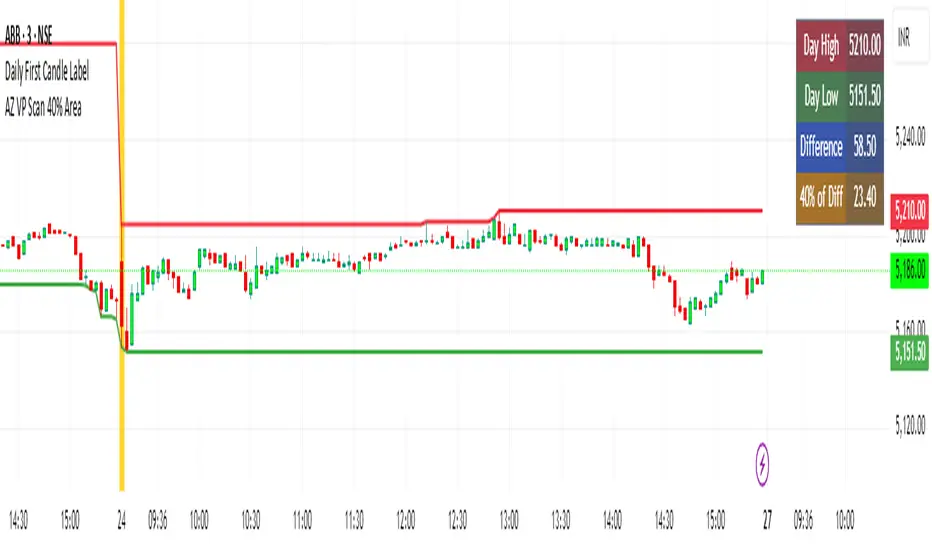
This indicator is developed by Ankur Zaveri, Gujarat, India. This indicator marks the Day's High and Day's Low for the underlying and calculates the difference between the two extrme values of the day in a separate table on the chart. It also shows 40% value of the difference between the Day's High and Day's Low to help scan the underlyings for taking trades based on Volume Profile.
受保護腳本
此腳本以閉源形式發佈。 不過,您可以自由使用,沒有任何限制 — 點擊此處了解更多。
免責聲明
這些資訊和出版物並非旨在提供,也不構成TradingView提供或認可的任何形式的財務、投資、交易或其他類型的建議或推薦。請閱讀使用條款以了解更多資訊。
免責聲明
這些資訊和出版物並非旨在提供,也不構成TradingView提供或認可的任何形式的財務、投資、交易或其他類型的建議或推薦。請閱讀使用條款以了解更多資訊。