OPEN-SOURCE SCRIPT
已更新 Daily Close Levels with ATR and Custom Offsets

Description:
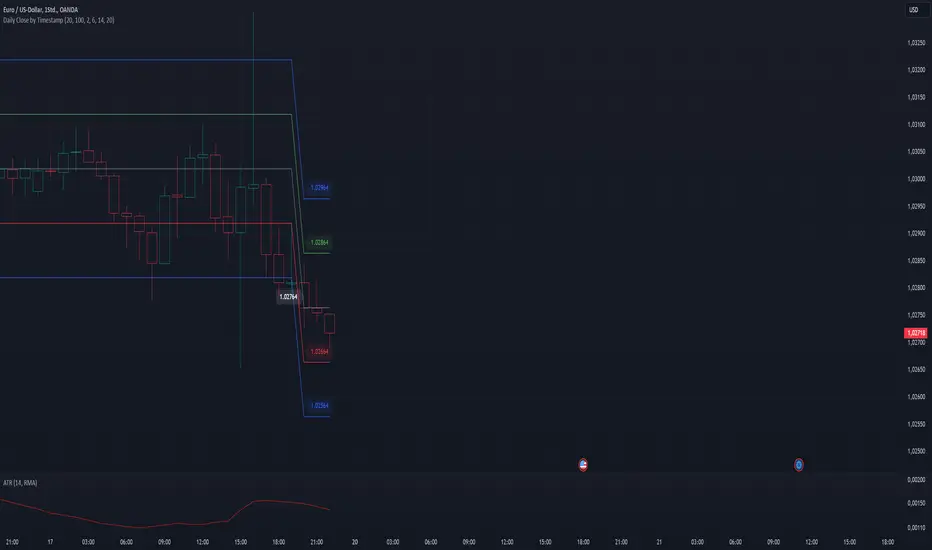
This Pine Script visualizes daily close levels, calculates key price zones based on custom offsets and ATR (Average True Range), and is an essential tool for traders analyzing support and resistance zones.
Features
Customizable Parameters:
This Pine Script visualizes daily close levels, calculates key price zones based on custom offsets and ATR (Average True Range), and is an essential tool for traders analyzing support and resistance zones.
Features
- Close Value Line: Displays the daily close value as a line on the chart.
- ATR Values: Shows the ATR value in both price and tick format.
- Custom Offsets:
Calculates positive and negative price levels based on a user-defined tick offset.
Supports multipliers for extended zones (e.g., 2x offset). - Labels:
Displays the close value and ATR on the chart.
Annotates calculated price levels directly on the corresponding lines. - Time Control: Calculates levels at a user-defined hour (e.g., 20:00).
Customizable Parameters:
- Close Time (Hour): Choose the specific hour for analyzing the close price.
- Custom Line Offset: Define the price offset in ticks.
- ATR Length: Adjust the ATR calculation length.
- Timezone Offset: Supports time adjustments for different time zones.
- Enable/Disable Labels and Values: Toggle the display of labels and values on the chart.
發行說明
Adjusted Label Positioning:- The labels for the custom close value and ATR have been updated to use style_label_right.
- This change ensures that the labels do not overlap with plotted lines, improving chart clarity and readability.
發行說明
Improved Label Management- Labels are now deleted upon updating to ensure that only the most recent values are displayed on the chart
發行說明
Added Input Variable: Offset distance ticks- Allows users to control the vertical distance of labels from the plotted lines.
- The offset is specified in ticks for precise positioning on the chart.
開源腳本
秉持TradingView一貫精神,這個腳本的創作者將其設為開源,以便交易者檢視並驗證其功能。向作者致敬!您可以免費使用此腳本,但請注意,重新發佈代碼需遵守我們的社群規範。
免責聲明
這些資訊和出版物並非旨在提供,也不構成TradingView提供或認可的任何形式的財務、投資、交易或其他類型的建議或推薦。請閱讀使用條款以了解更多資訊。
開源腳本
秉持TradingView一貫精神,這個腳本的創作者將其設為開源,以便交易者檢視並驗證其功能。向作者致敬!您可以免費使用此腳本,但請注意,重新發佈代碼需遵守我們的社群規範。
免責聲明
這些資訊和出版物並非旨在提供,也不構成TradingView提供或認可的任何形式的財務、投資、交易或其他類型的建議或推薦。請閱讀使用條款以了解更多資訊。